Fig. 3
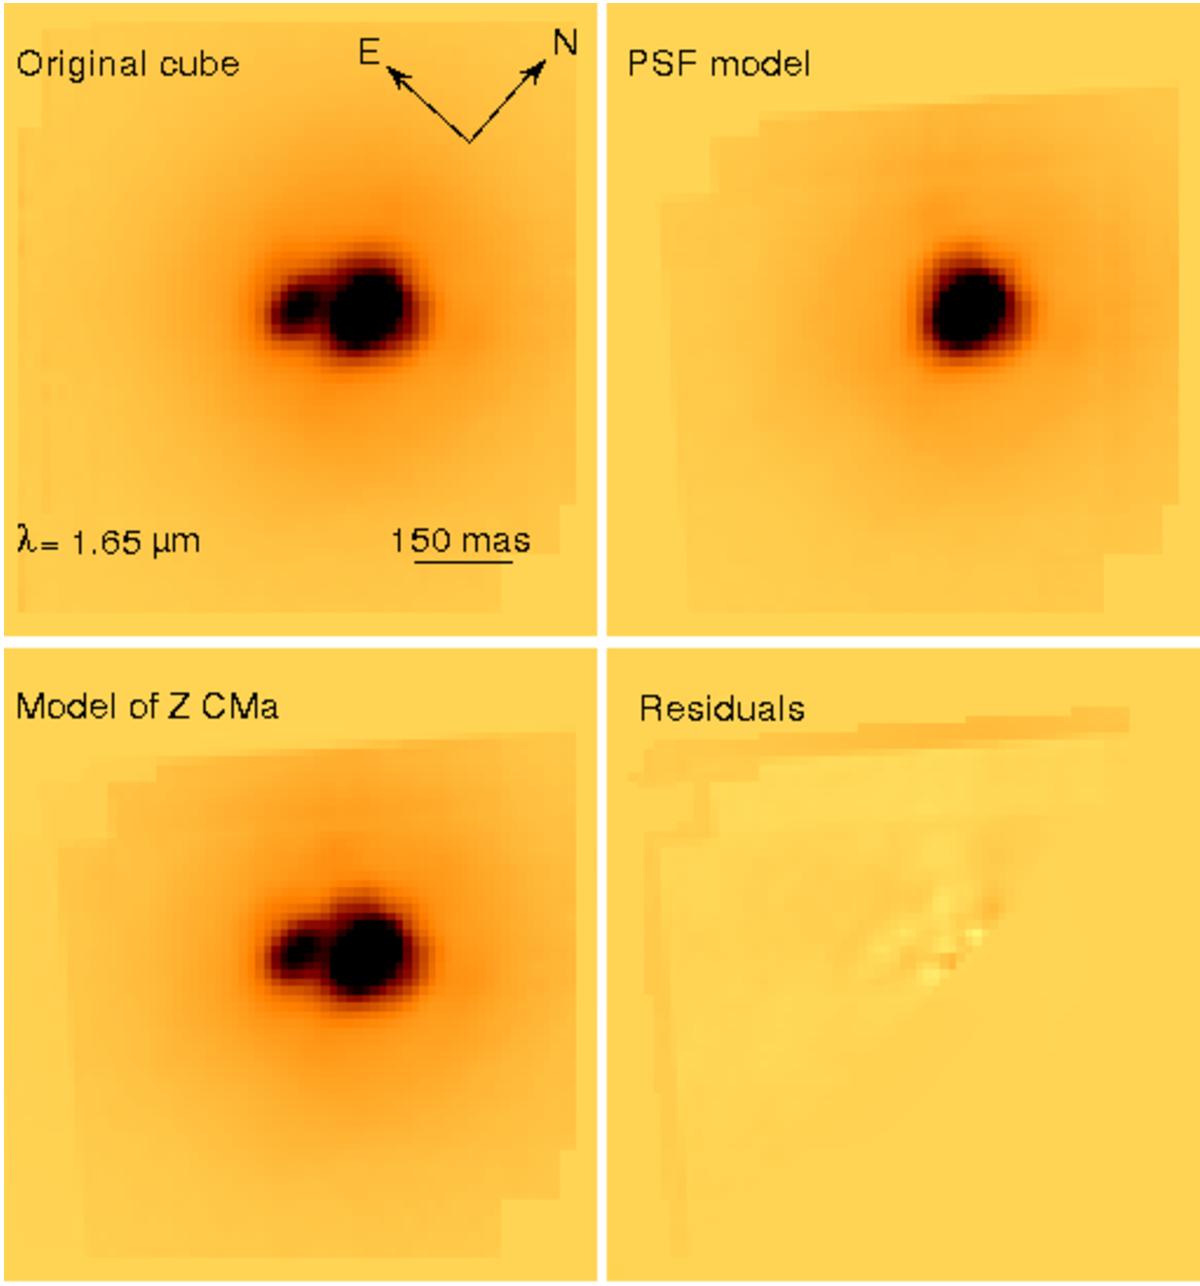
Illustration of the spectral deblending process at 1.65 μm. Upper left: the initial Z CMa datacube where the two components are resolved. Upper right: during the observation, the adaptive-optics corrected PSF showed a strong astigmatism. To achieve a proper extraction of the spectra of the Z CMa components, we duplicated the HBe star profile to create a PSF model. Lower left: the position and the flux of the individual sources were then retrieved using a modified version of the CLEAN algorithm. Lower right: the extraction error is estimated from the residuals.
Current usage metrics show cumulative count of Article Views (full-text article views including HTML views, PDF and ePub downloads, according to the available data) and Abstracts Views on Vision4Press platform.
Data correspond to usage on the plateform after 2015. The current usage metrics is available 48-96 hours after online publication and is updated daily on week days.
Initial download of the metrics may take a while.