Fig. 13
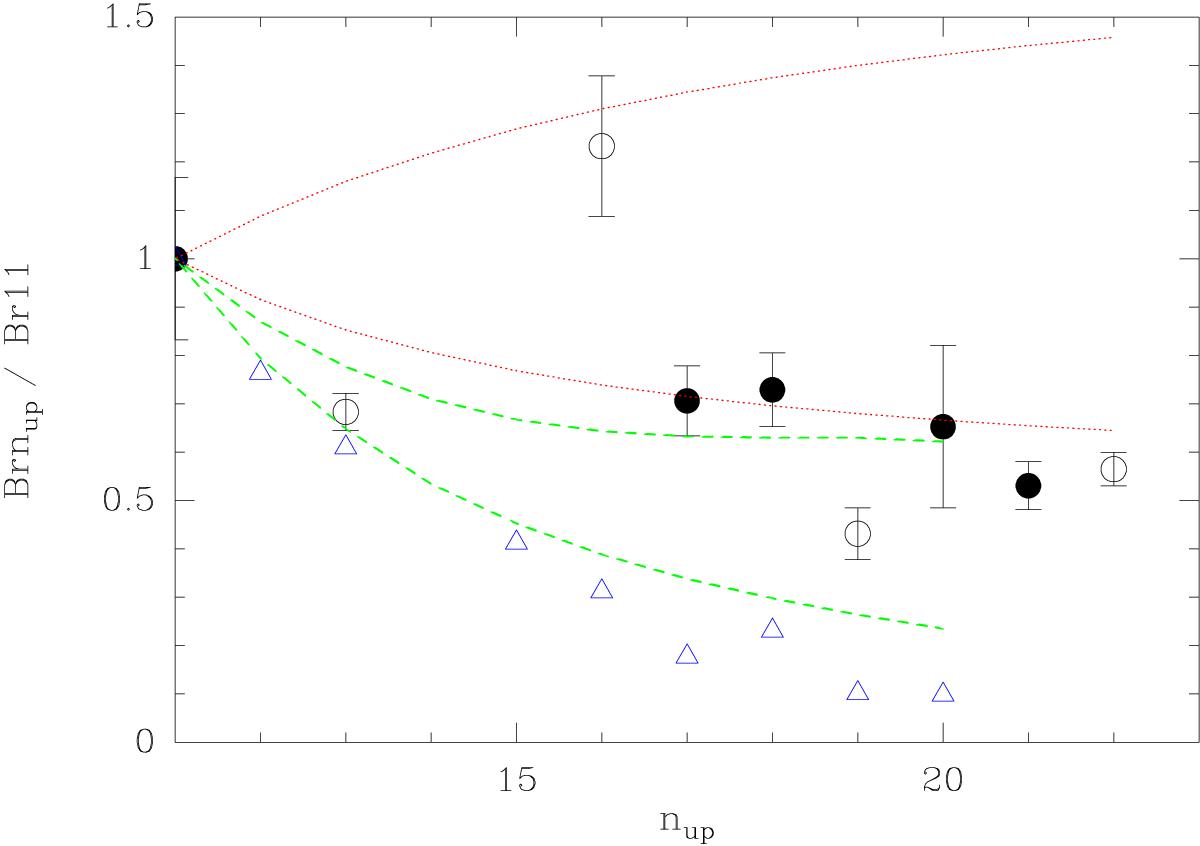
H band HI Brackett excitation diagram for the HBe of ZCMa (circles). All line fluxes are normalized to the HI Brackett 11 line. Open circles show the lines that are probably contaminated. Blue triangles show the line ratios detected in EX Lupi (Kóspál et al. 2011b). The green curves are predictions from case B recombination from Hummer & Storey (1987) for T = 104 K and n = 108 cm-3 (lower curve) and for T = 500 K and n = 107 cm-3 (upper curve). The red dotted lines show expected line ratios from blackbody emission at T = 1000 K (lower curve) and T = 104 K (upper curve).
Current usage metrics show cumulative count of Article Views (full-text article views including HTML views, PDF and ePub downloads, according to the available data) and Abstracts Views on Vision4Press platform.
Data correspond to usage on the plateform after 2015. The current usage metrics is available 48-96 hours after online publication and is updated daily on week days.
Initial download of the metrics may take a while.