Fig. 10
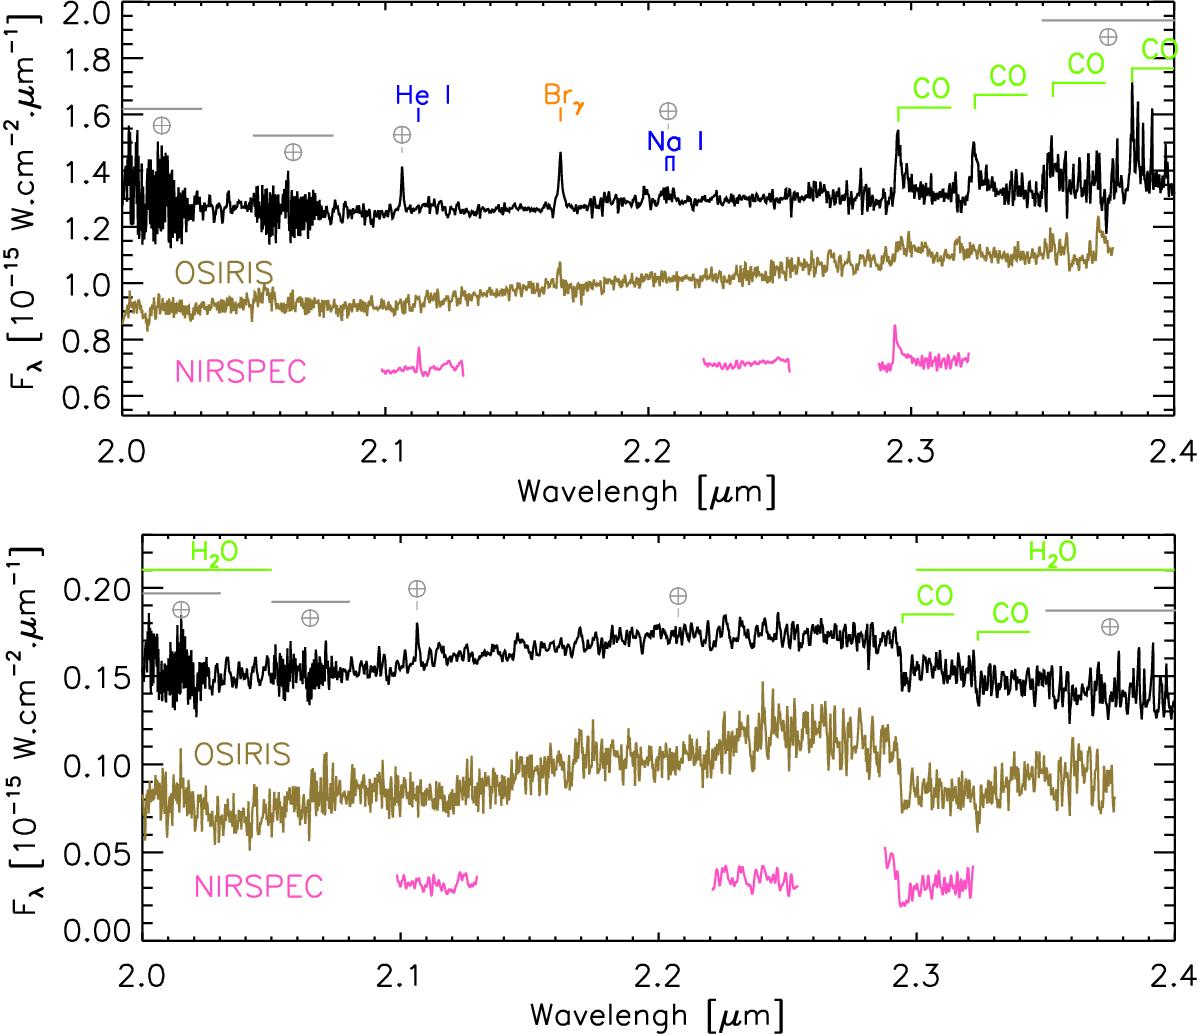
Same as Fig. 9 but for the K band. The normalized NIRSPEC spectra (with respect to the continuum of the SINFONI spectra) of the system components obtained while the binary was in a quiescent state (December 17, 2006) are overlaid in pink. The fluxes of the OSIRIS spectra are normalized to the median flux of the SINFONI spectra between 2.18 and 2.22 μm and shifted to lower values for clarity.
Current usage metrics show cumulative count of Article Views (full-text article views including HTML views, PDF and ePub downloads, according to the available data) and Abstracts Views on Vision4Press platform.
Data correspond to usage on the plateform after 2015. The current usage metrics is available 48-96 hours after online publication and is updated daily on week days.
Initial download of the metrics may take a while.