Free Access
Fig. 9
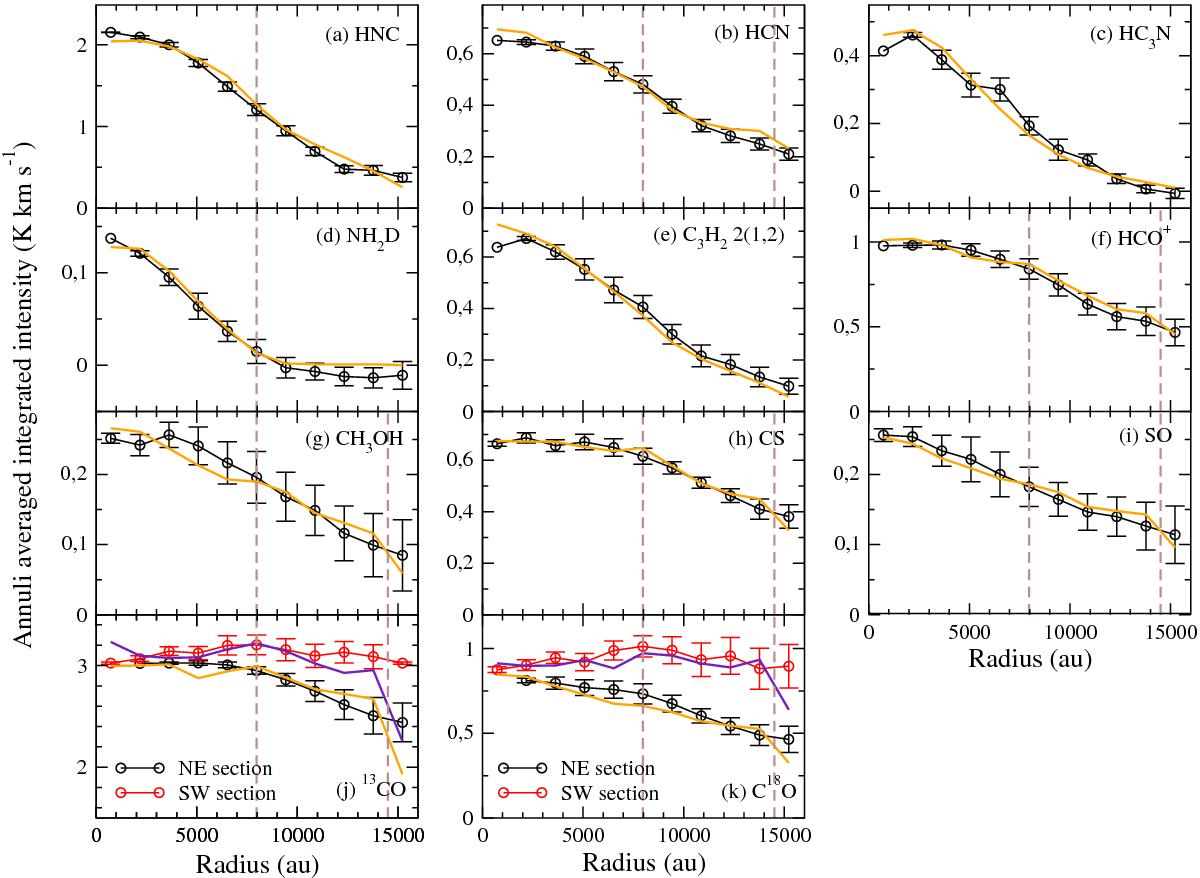
FTS molecular lines abundance fits. Annuli averaged integrated intensity vs. annuli radius. Black and red lines: FTS data profiles. Orange and violet lines: ARTIST data profiles with estimated abundances. Brown vertical dashed lines indicate the radius where there is a change in abundance (see Table 5).
Current usage metrics show cumulative count of Article Views (full-text article views including HTML views, PDF and ePub downloads, according to the available data) and Abstracts Views on Vision4Press platform.
Data correspond to usage on the plateform after 2015. The current usage metrics is available 48-96 hours after online publication and is updated daily on week days.
Initial download of the metrics may take a while.