Fig. 8
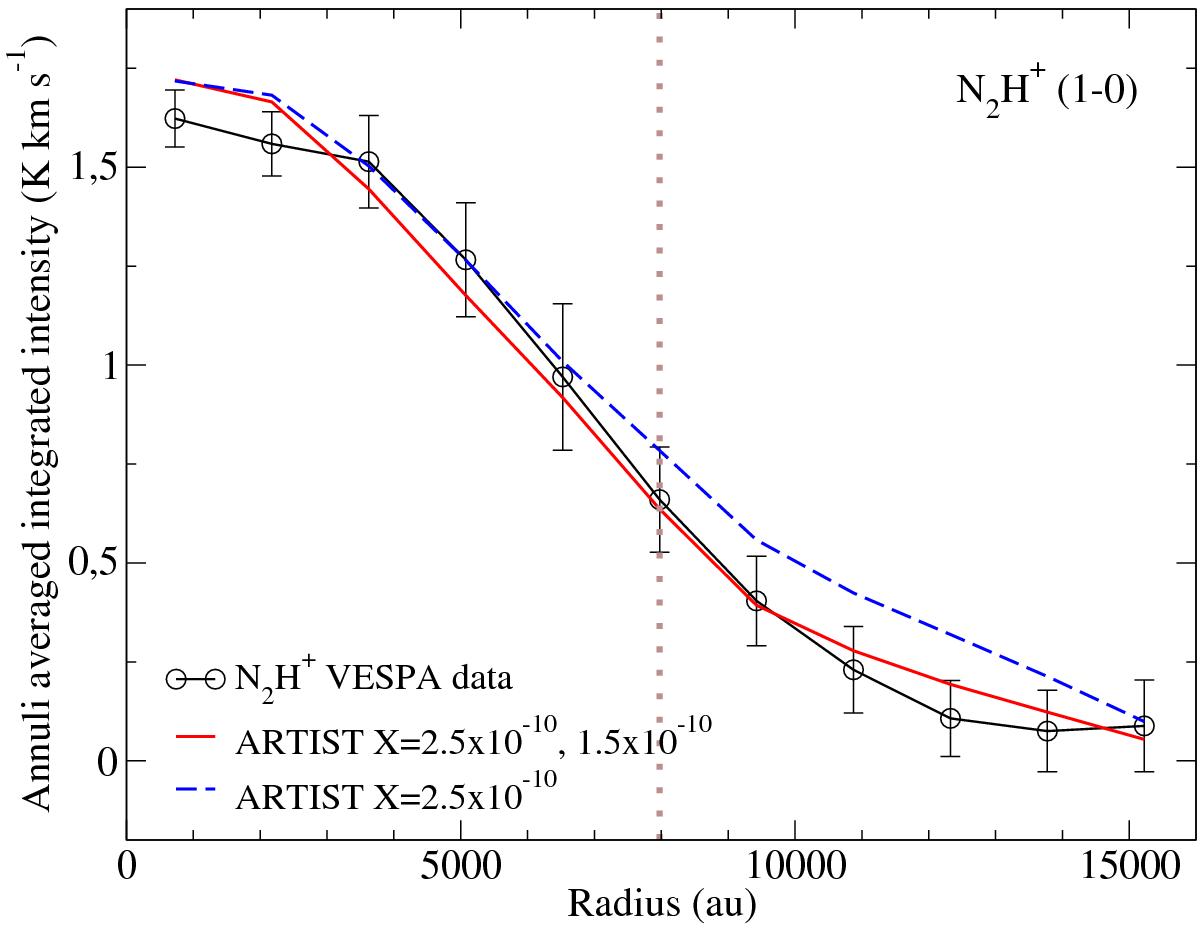
N2H+ ARTIST abundance estimate. Annuli averaged integrated intensity vs. annuli radius. Black line: IRAM 30 m VESPA data. Blue dashed line: ARTIST radial integrated intensity profile for a constant abundance of 2.5 × 10⁻¹⁰. Red line: ARTIST radial integrated intensity profile with a step function abundance of 2.5 × 10⁻¹⁰ and 1.5 × 10⁻¹⁰ for smaller and larger radius than ~8000 au (55 arcsec; indicated by the brown vertical dotted line), respectively.
Current usage metrics show cumulative count of Article Views (full-text article views including HTML views, PDF and ePub downloads, according to the available data) and Abstracts Views on Vision4Press platform.
Data correspond to usage on the plateform after 2015. The current usage metrics is available 48-96 hours after online publication and is updated daily on week days.
Initial download of the metrics may take a while.