Fig. 6
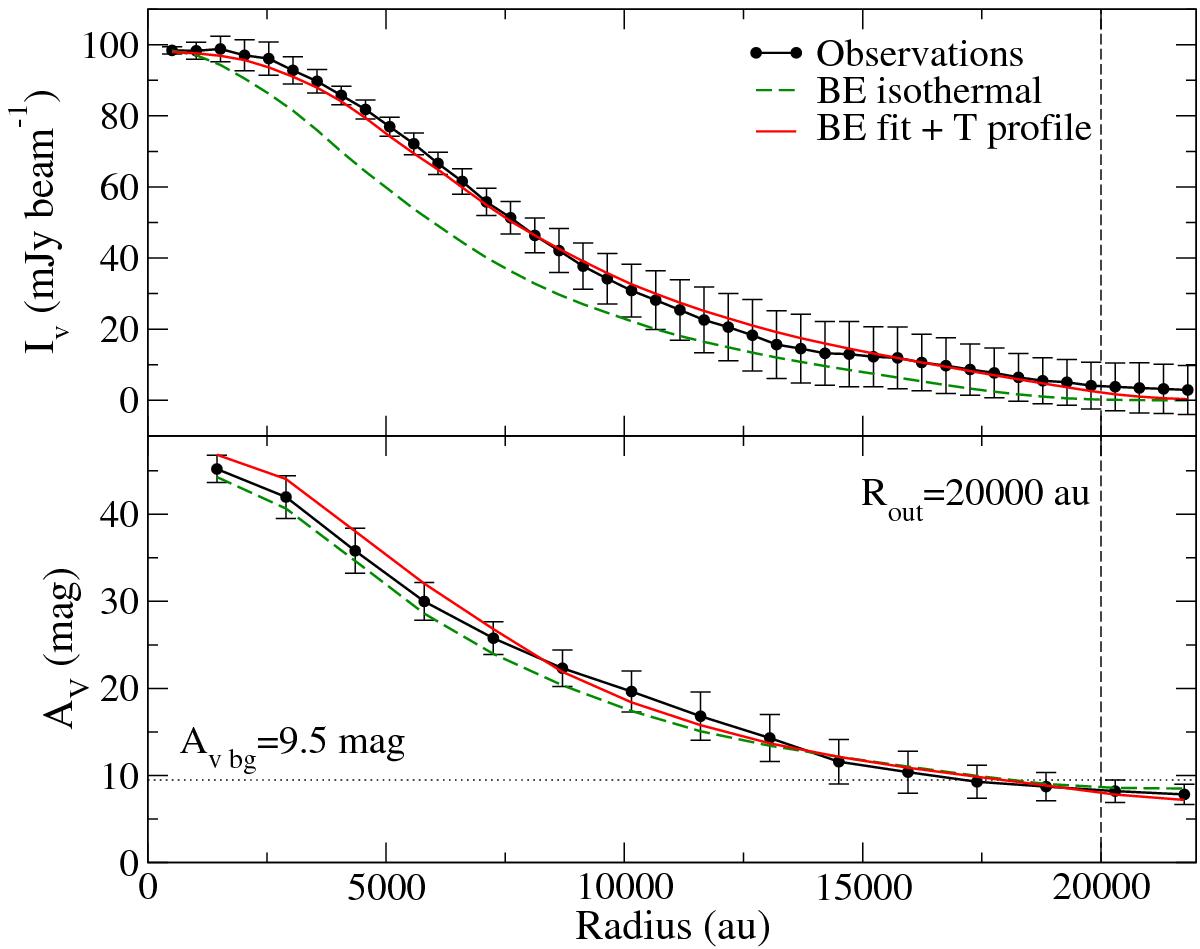
Upper panel: intensity profile from the 1.2 mm dust continuum emission map (Frau et al. 2010, 2012b). Black line and dots: observed values with vertical bars depicting the ± 1-σ range. Green (long-dashed) line: isothermal Bonnor-Ebert fit. Red (solid) line: fit Bonnor-Ebert profile adding the temperature profile shown in the upper panel of Fig. 7. The best fitting central density is ρc = 2 × 105 cm-3. The fit core boundary radius, Rout = 20 000 au is marked by a vertical dashed line. Lower panel: AV profile from the dust extinction map (Román-Zúñiga et al. 2009, 2010). Black, green (long-dashed) and red (solid) lines as in upper panel. The fit core boundary radius, Rout = 20 000 au, and AV value of the surrounding medium, ![]() mag, are labeled and marked by a vertical dashed line and horizontal dotted line, respectively.
mag, are labeled and marked by a vertical dashed line and horizontal dotted line, respectively.
Current usage metrics show cumulative count of Article Views (full-text article views including HTML views, PDF and ePub downloads, according to the available data) and Abstracts Views on Vision4Press platform.
Data correspond to usage on the plateform after 2015. The current usage metrics is available 48-96 hours after online publication and is updated daily on week days.
Initial download of the metrics may take a while.