Fig. 5
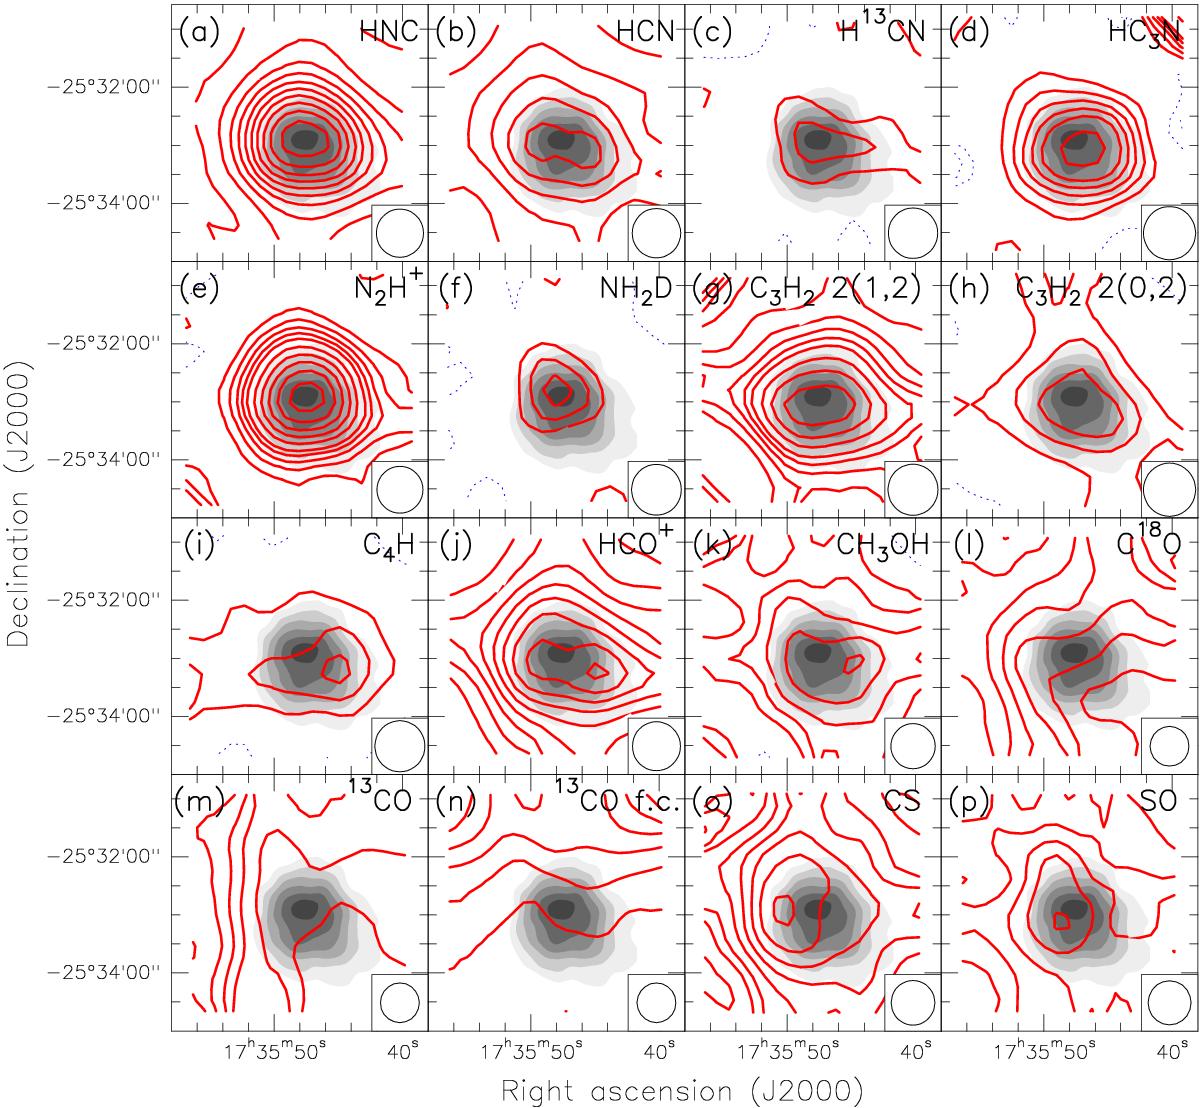
Red contours: averaged intensity maps of the observed molecular transition indicated in each panel. Contours in a), j) and l) are 10, 20, 30, ... times the rms of the maps, 8, 6 and 9 mK, respectively. In panels m) and n) contours are 20, 23, 26, ... and −3, 3, 6, 9, ... times the rms, 53 mK, respectively. In panels b) and h), k) and p) countours are −3, 3, 6, 9, 12, 15, 20, ... times the rms, 21 mK and 16 mK, respectively. In the rest of the maps contours are −3, 3, 6, 9, 12, 15, 20, 25, 30, 35, ... times the rms, 10 mK. Panel n) shows a fainter component of the 13CO molecular line. The beam size of each molecular line is shown at the bottom right corner of each panel. Gray scale: IRAM 30 m MAMBO-II map of the dust continuum emission at 1.2 mm at an angular resolution of 21 arcsec.
Current usage metrics show cumulative count of Article Views (full-text article views including HTML views, PDF and ePub downloads, according to the available data) and Abstracts Views on Vision4Press platform.
Data correspond to usage on the plateform after 2015. The current usage metrics is available 48-96 hours after online publication and is updated daily on week days.
Initial download of the metrics may take a while.