Fig. 2
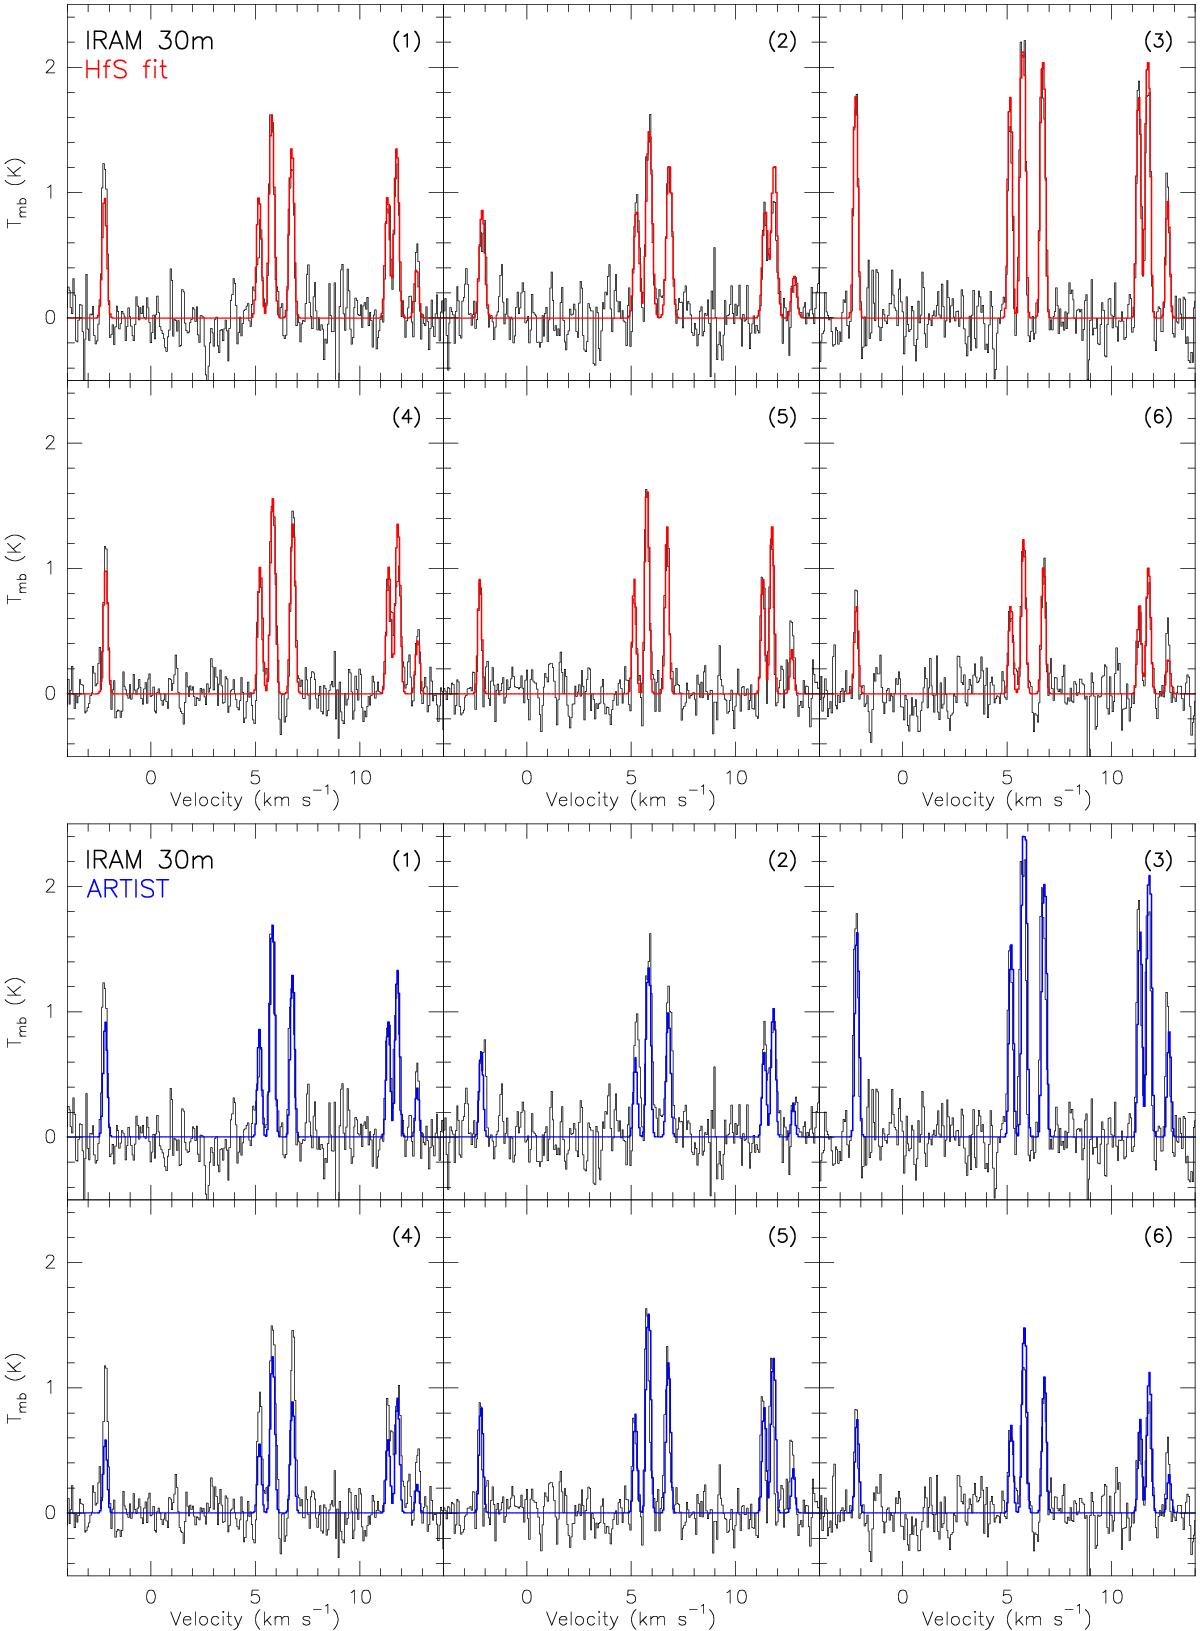
Upper pannels: HfS fit of the hyperfine structure of N2H+ (1−0) IRAM 30 m spectral data at different positions of the core (labeled in Fig. 1c). Black and red lines are the observational data and the fit, respectively. Lower panels: ARTIST simulated N2H+ (1−0) spectral data (see Sect. 4.2). Black and blue lines are the observational and simulated data, respectively. We note that the simulated core from ARTIST is spherically symmetric. The discrepancies between the observational and the simulated spectra in panel (4) may be due to the slightly elongated shape of the core towards the west.
Current usage metrics show cumulative count of Article Views (full-text article views including HTML views, PDF and ePub downloads, according to the available data) and Abstracts Views on Vision4Press platform.
Data correspond to usage on the plateform after 2015. The current usage metrics is available 48-96 hours after online publication and is updated daily on week days.
Initial download of the metrics may take a while.