Fig. 11
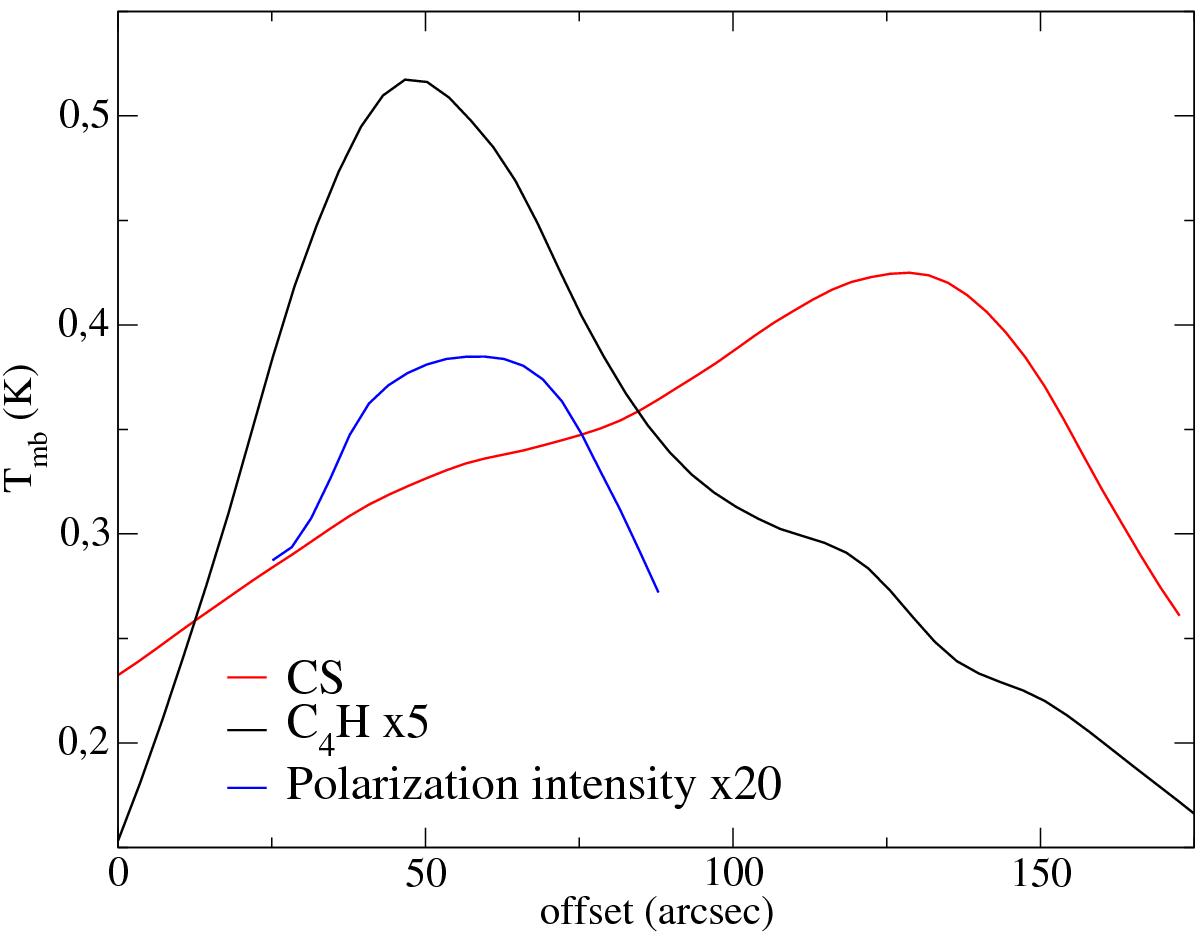
Intensity from CS (red), C4H (black) and polarization intensity (blue) along a 1-D slice from the southwest part of the core towards the east passing through the C4H and CS peaks (see panels a) and c) of Fig. 10). Both C4H and the polarization intensity increase at the same positions in the core along the slice. CS shows an anti-correlation with the polarization intensity.
Current usage metrics show cumulative count of Article Views (full-text article views including HTML views, PDF and ePub downloads, according to the available data) and Abstracts Views on Vision4Press platform.
Data correspond to usage on the plateform after 2015. The current usage metrics is available 48-96 hours after online publication and is updated daily on week days.
Initial download of the metrics may take a while.