Fig. 10
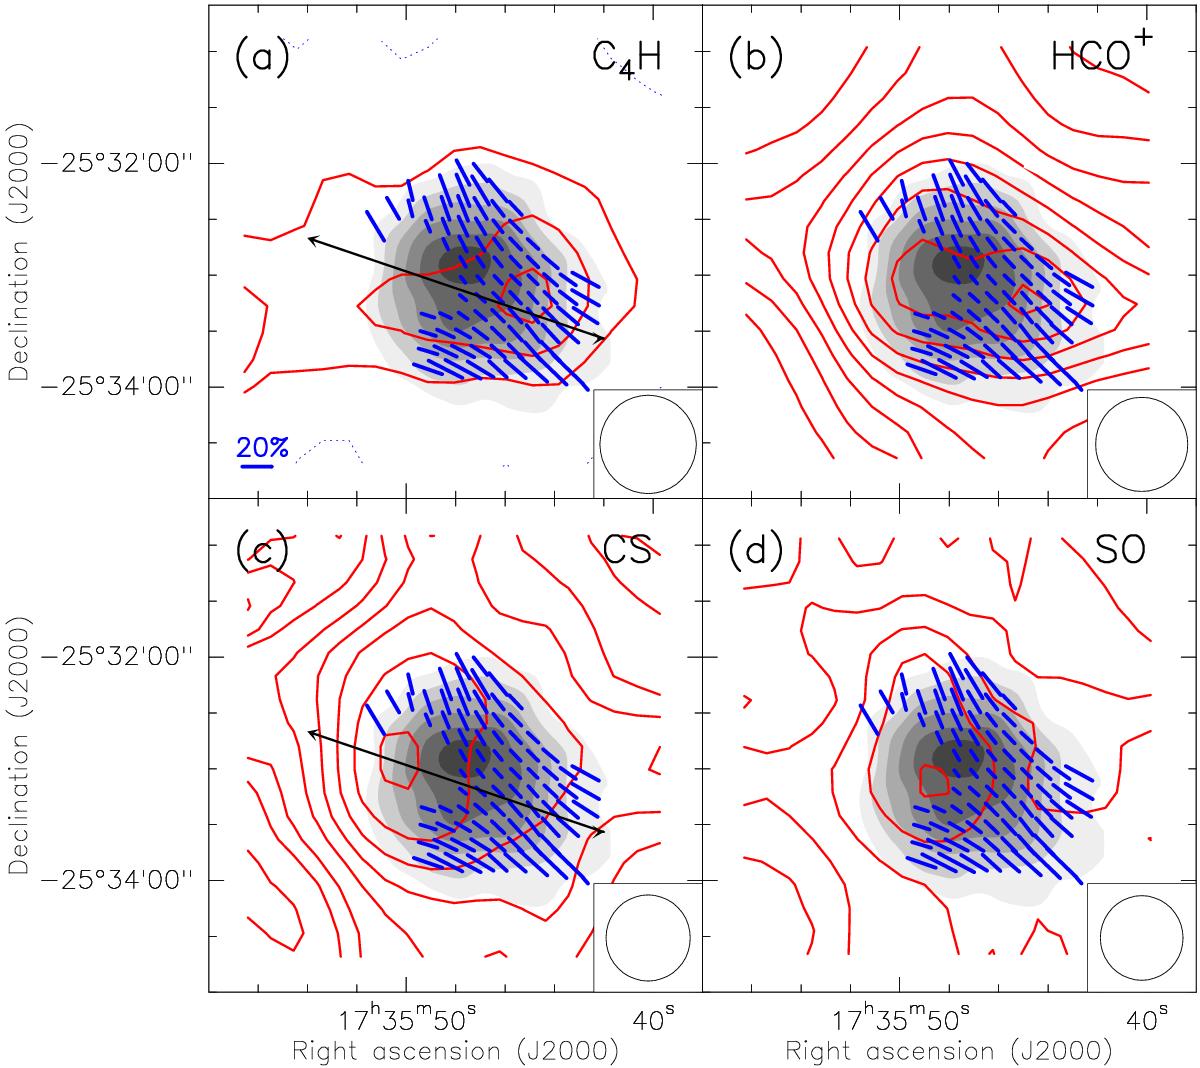
Polarization maps. Red contours: averaged intensity maps of a) C4H, b) HCO+, c) CS and d) SO. Contours in panels a) and c) are −3, 3, 6, 9, 12, 15, 20, 25, 30, ... times the rms of the maps, 10 mK. Contours in panel b) and d) are 10, 20, 30, ... and −3, 3, 6, 9, 12, 15 times the rms of the maps, 6, and 16 mK. The beam size of each molecular line is shown at the bottom right corner of each panel. Gray scale: IRAM 30 m MAMBO-II map of the dust continuum emission at 1.2 mm. Blue segments: position angle of the linearly polarized data from Alves et al. (2014). The length of the segments is proportional to the polarization fraction. Black arrows in panels a) and c) indicate the 1-D slice shown in Fig. 11.
Current usage metrics show cumulative count of Article Views (full-text article views including HTML views, PDF and ePub downloads, according to the available data) and Abstracts Views on Vision4Press platform.
Data correspond to usage on the plateform after 2015. The current usage metrics is available 48-96 hours after online publication and is updated daily on week days.
Initial download of the metrics may take a while.