Fig. 1
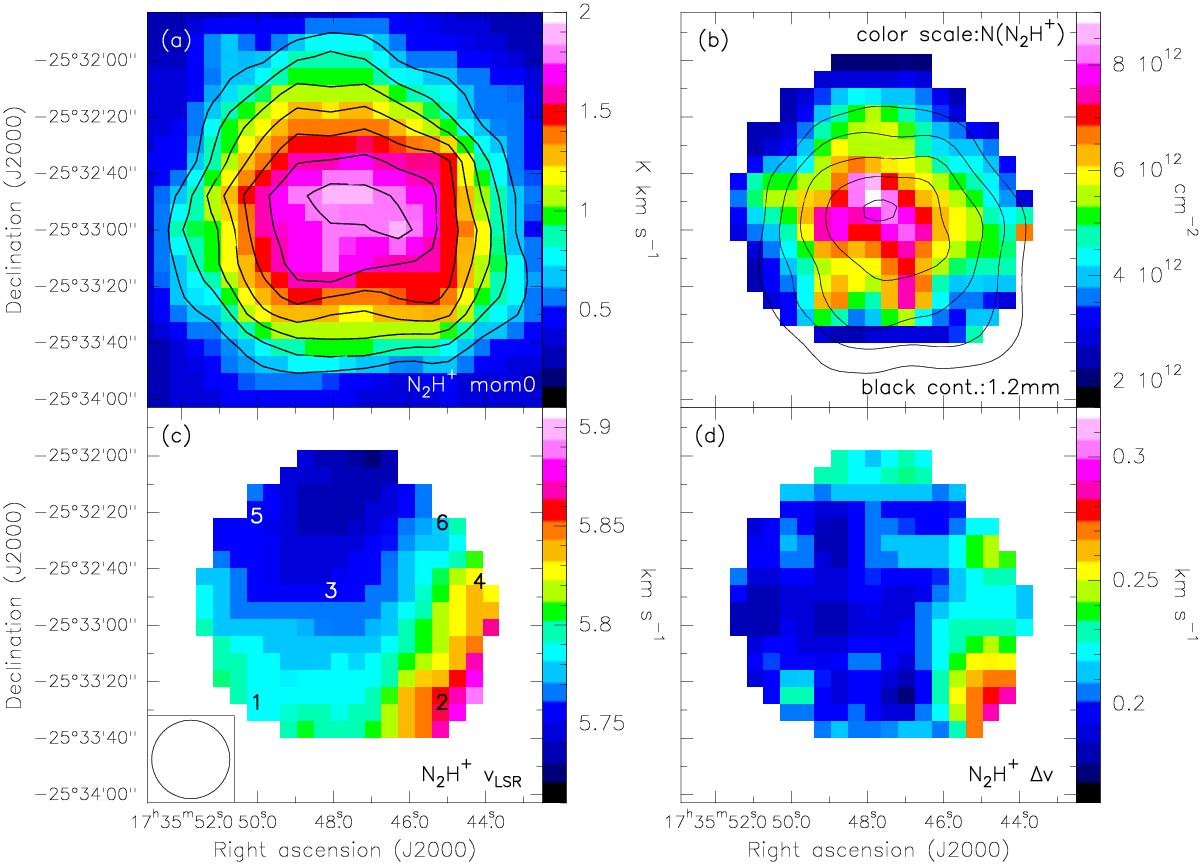
N2H+ (1−0) IRAM 30 m VESPA data. a) Moment-zero map (using the three central hyperfine lines) of the IRAM 30 m data. Contours are 35, 45, ..., 95 percent of the value of the peak, 1.9 K km s-1. b) Color scale: column density map. Black contours: IRAM 30 m MAMBO-II 1.2 mm dust continuum emission at an angular resolution of 21 arcsec. Contour levels are 30, 40, 50, 60, 70 and 80 percent of the peak value, 122 mJy beam-1. c) Velocity map and d) line width map resulting from the hyperfine fit. Numbers in panel c) indicate the position of the fit spectra shown in Fig. 2 and Table 2. The HPBW of 27.8 arcsec is shown at bottom left corner of panel c).
Current usage metrics show cumulative count of Article Views (full-text article views including HTML views, PDF and ePub downloads, according to the available data) and Abstracts Views on Vision4Press platform.
Data correspond to usage on the plateform after 2015. The current usage metrics is available 48-96 hours after online publication and is updated daily on week days.
Initial download of the metrics may take a while.