Fig. 6
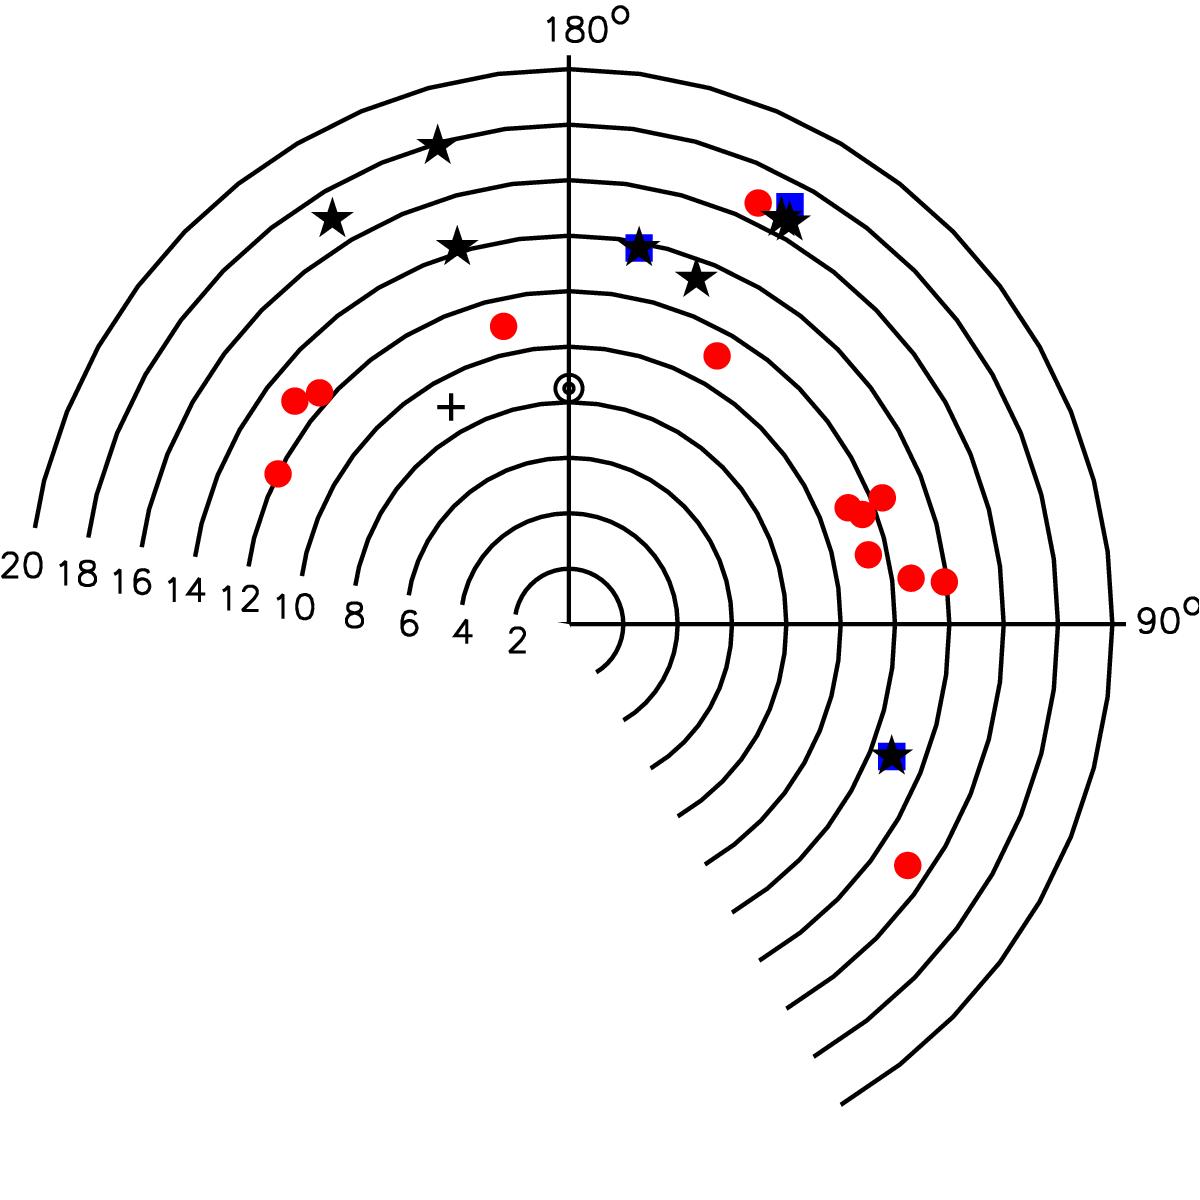
Distribution of the H ii regions analysed in this study projected onto the Galactic plane. The numbers close to the circles show distances to the Galactic centre in kpc. Red circles denote regions with abundances estimated with direct methods, black squares represent results from tailor-made models, and blue squares plot the abundances obtained from the ![]() relation. Regions with chemical abundances estimated with two methods are represented twice. The Sun and M 42 are also represented at RG = 8.5 kpc (black solar symbol) and RG = 8.95 kpc (black cross), respectively.
relation. Regions with chemical abundances estimated with two methods are represented twice. The Sun and M 42 are also represented at RG = 8.5 kpc (black solar symbol) and RG = 8.95 kpc (black cross), respectively.
Current usage metrics show cumulative count of Article Views (full-text article views including HTML views, PDF and ePub downloads, according to the available data) and Abstracts Views on Vision4Press platform.
Data correspond to usage on the plateform after 2015. The current usage metrics is available 48-96 hours after online publication and is updated daily on week days.
Initial download of the metrics may take a while.