Fig. 4
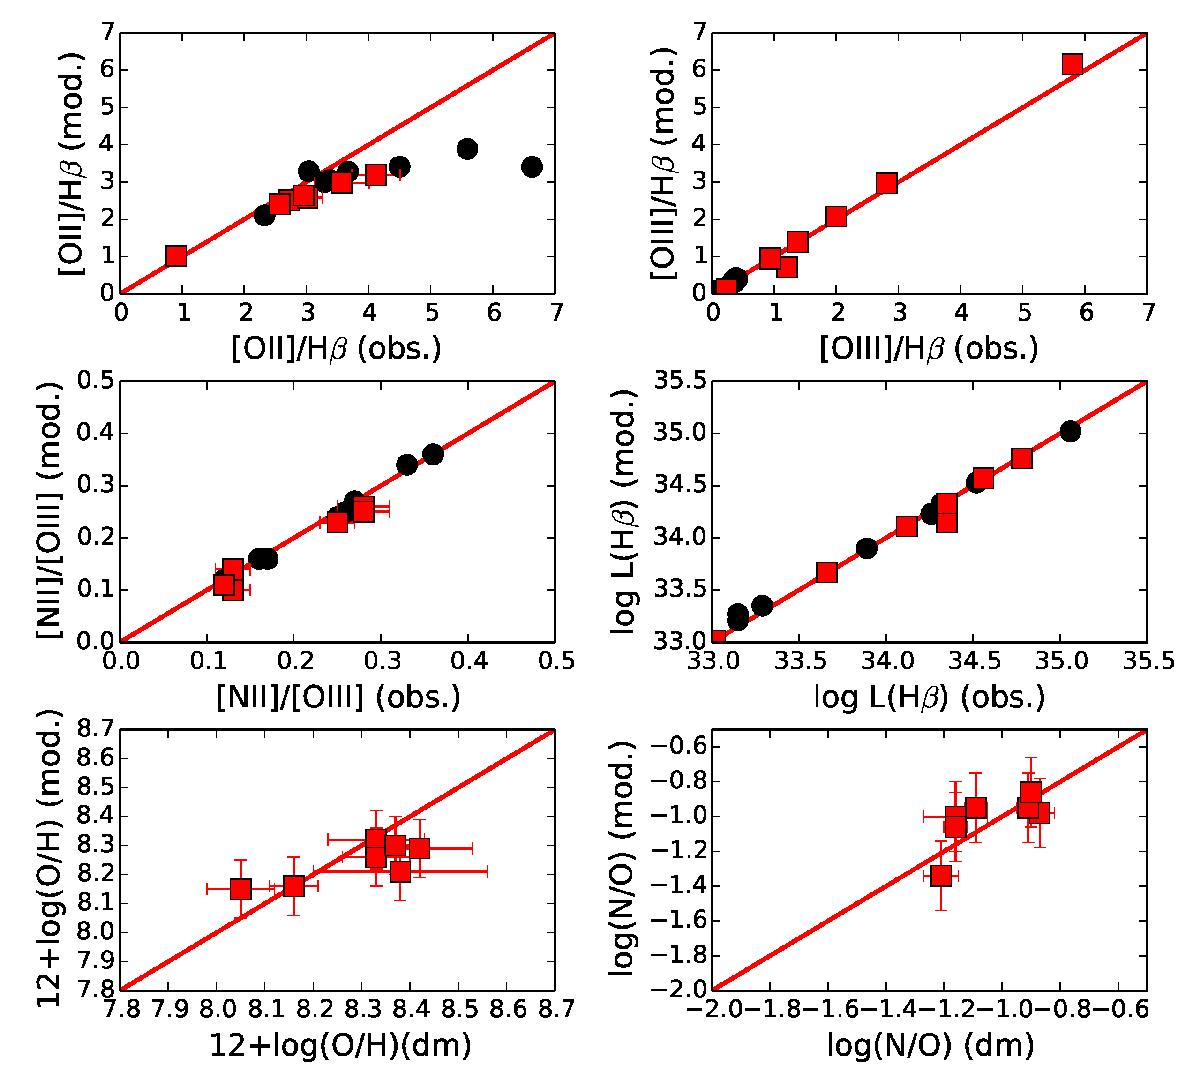
Upper and middle rows show a comparison between observed quantities and the found solutions of the tailor-made models, while in the last row we compare the chemical abundances obtained from models with those derived with the direct method. Red squares represent H ii regions with direct estimations of Te and black circles represent regions without a detection of any auroral temperature-sensitive emission line.
Current usage metrics show cumulative count of Article Views (full-text article views including HTML views, PDF and ePub downloads, according to the available data) and Abstracts Views on Vision4Press platform.
Data correspond to usage on the plateform after 2015. The current usage metrics is available 48-96 hours after online publication and is updated daily on week days.
Initial download of the metrics may take a while.