Fig. 3
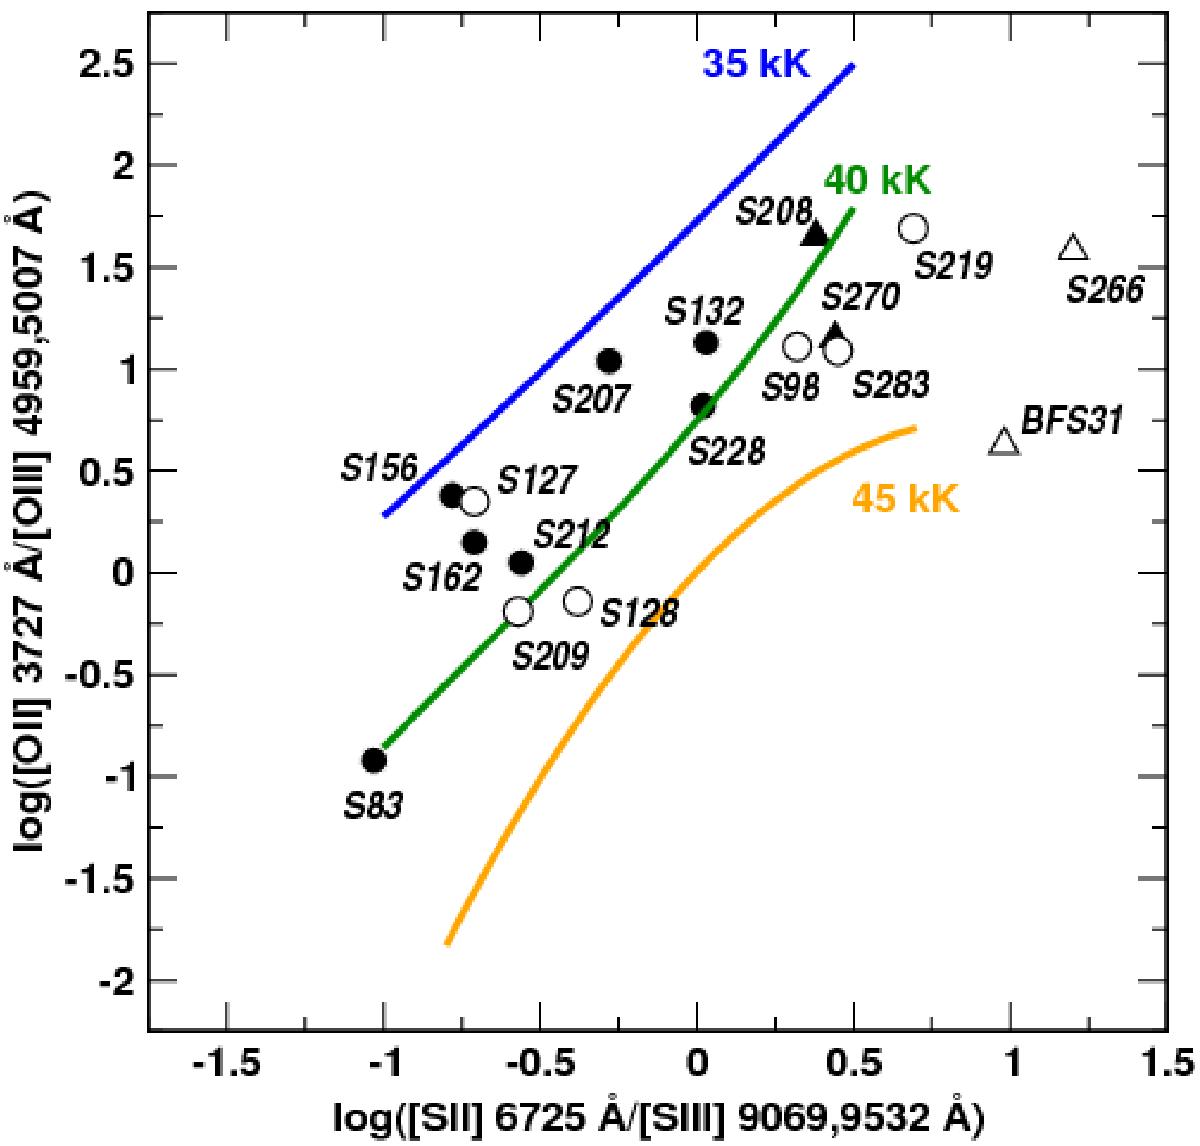
[S ii]/[S iii] versus [O ii]/[O iii] in logarithm units compared with a grid of WM-Basic models at Z = 0.2 Z⊙. The solid lines represent models with the same effective temperature as indicated. Circles show H ii regions with reliable line emission measurements and triangles regions with upper limit intensities. Filled symbols represent data from our own sample (observed regions) while open symbols represent regions taken from the literature.
Current usage metrics show cumulative count of Article Views (full-text article views including HTML views, PDF and ePub downloads, according to the available data) and Abstracts Views on Vision4Press platform.
Data correspond to usage on the plateform after 2015. The current usage metrics is available 48-96 hours after online publication and is updated daily on week days.
Initial download of the metrics may take a while.