Free Access
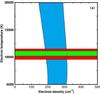
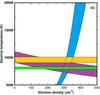
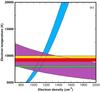
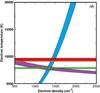
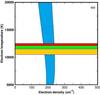
Fig. 2
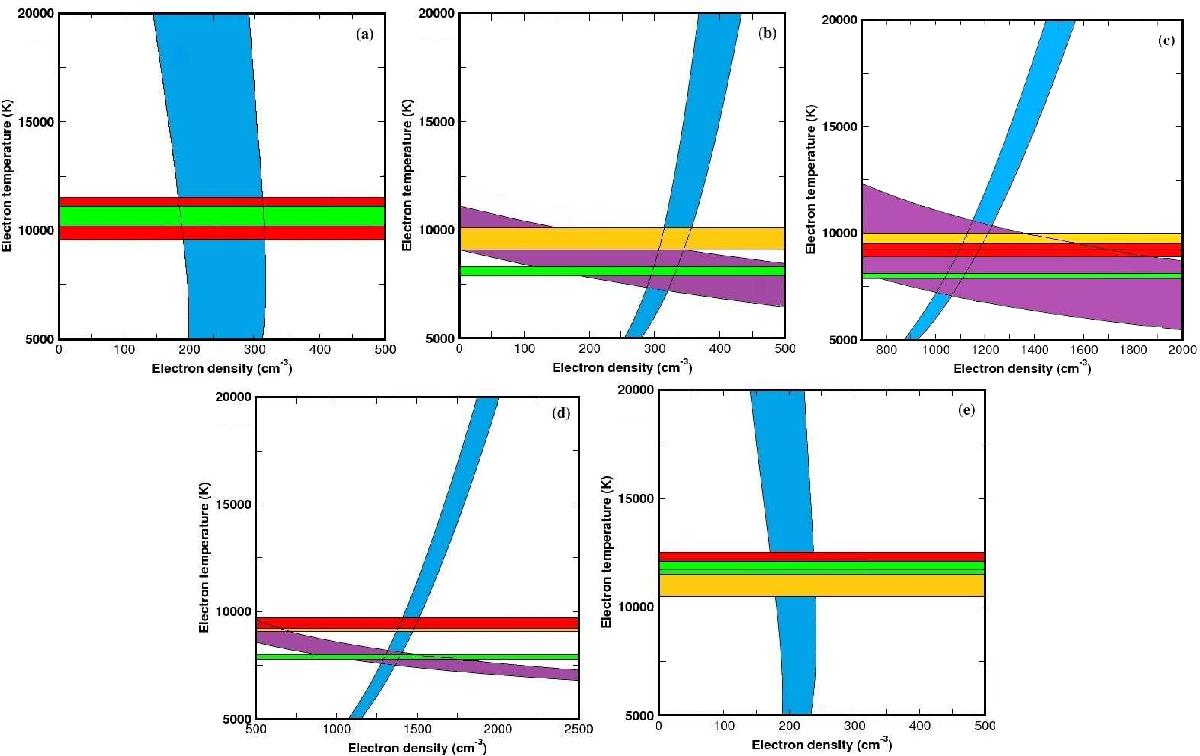
Te−ne diagnostic diagrams of H ii regions observed with ISIS with direct electron temperatures estimations: a) S83; b) S132; c) S156, d) S162; and e) S212. Blue bands correspond to ne, purple to te([S ii]), yellow to te([N ii]), red to te([O iii]), and green to te([S iii]).
This figure is made of several images, please see below:
Current usage metrics show cumulative count of Article Views (full-text article views including HTML views, PDF and ePub downloads, according to the available data) and Abstracts Views on Vision4Press platform.
Data correspond to usage on the plateform after 2015. The current usage metrics is available 48-96 hours after online publication and is updated daily on week days.
Initial download of the metrics may take a while.