Fig. 14
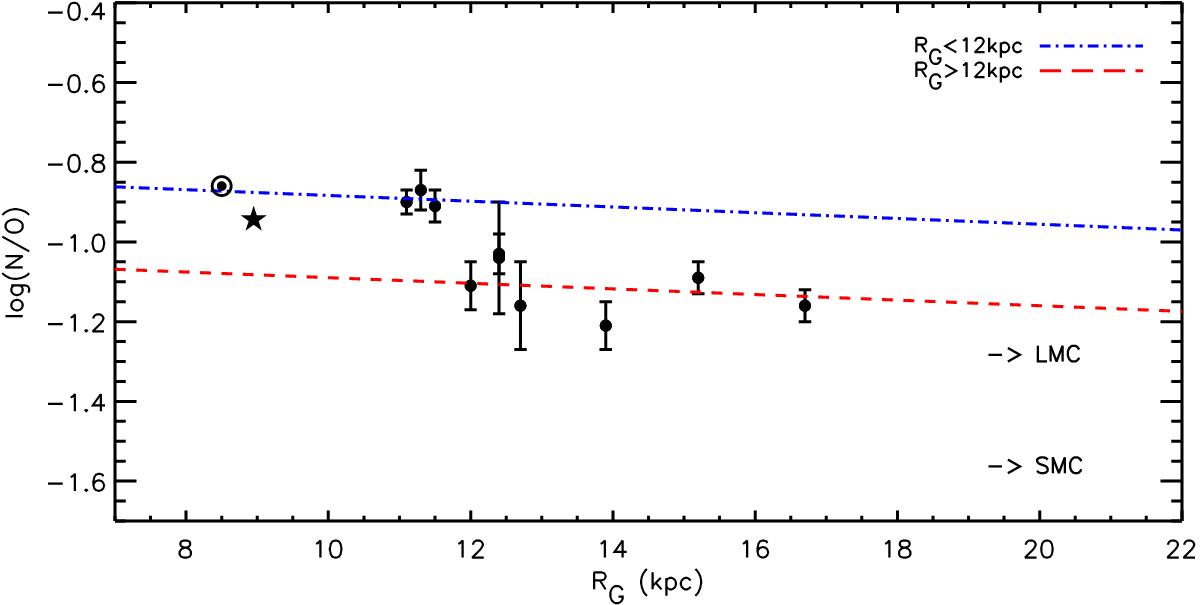
Radial distribution of N/O plotted versus Galactocentric radius. Black points represent N/O abundances obtained with the direct method. The two lines represent the fit to data in two distances ranges: within 12 kpc from the Galactic centre (blue dot-dashed line) and farther than this limit (red dashed line), see text for details. The Orion nebula, the Sun and Magellanic Clouds are represented as in Fig. 13.
Current usage metrics show cumulative count of Article Views (full-text article views including HTML views, PDF and ePub downloads, according to the available data) and Abstracts Views on Vision4Press platform.
Data correspond to usage on the plateform after 2015. The current usage metrics is available 48-96 hours after online publication and is updated daily on week days.
Initial download of the metrics may take a while.