Fig. 13
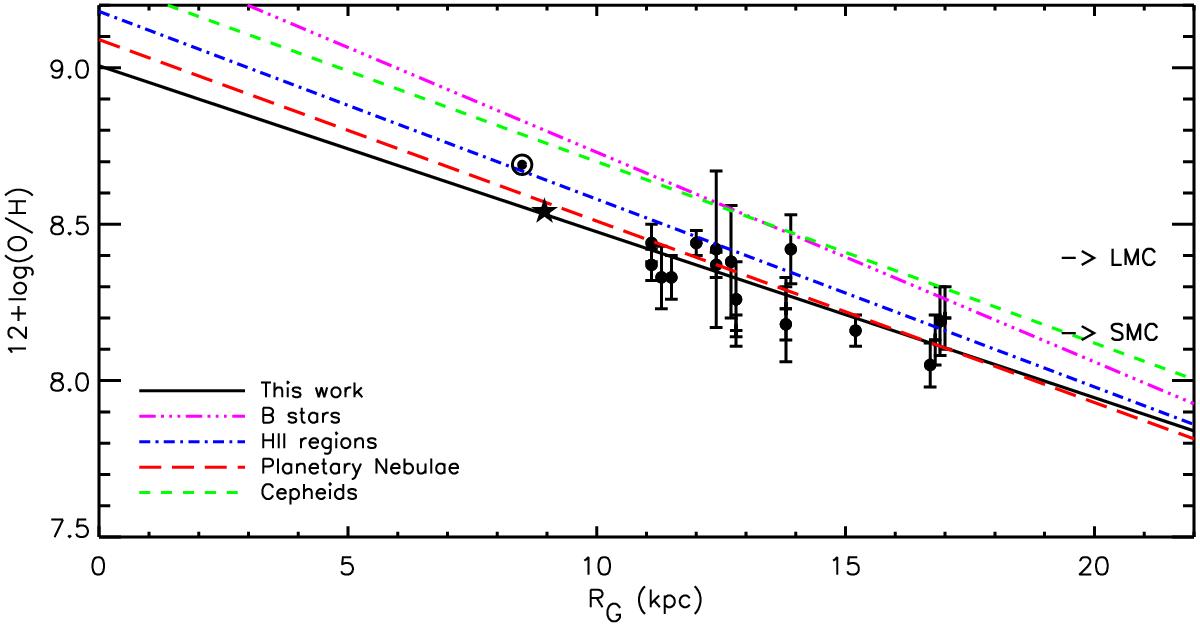
Extrapolated gradients of 12 + log(O/H) along the Galactic disc for different sources. Black circles represent all the H ii regions studied in this work and the solid black line indicates the gradient obtained with them. Gradients derived from PNs (long dashed red line), H ii regions (dash-dotted blue line), B-type stars (dash-dot-dotted pink line) and Cepheids (short-dashed green line) are also represented. The Sun and the Orion nebula (M42) are shown at their respective O/H abundances located at RG = 8.5 kpc and RG = 8.95 kpc, respectively. Horizontal arrows show chemical abundances of the Small and Large Magellanic Clouds.
Current usage metrics show cumulative count of Article Views (full-text article views including HTML views, PDF and ePub downloads, according to the available data) and Abstracts Views on Vision4Press platform.
Data correspond to usage on the plateform after 2015. The current usage metrics is available 48-96 hours after online publication and is updated daily on week days.
Initial download of the metrics may take a while.