Fig. 1
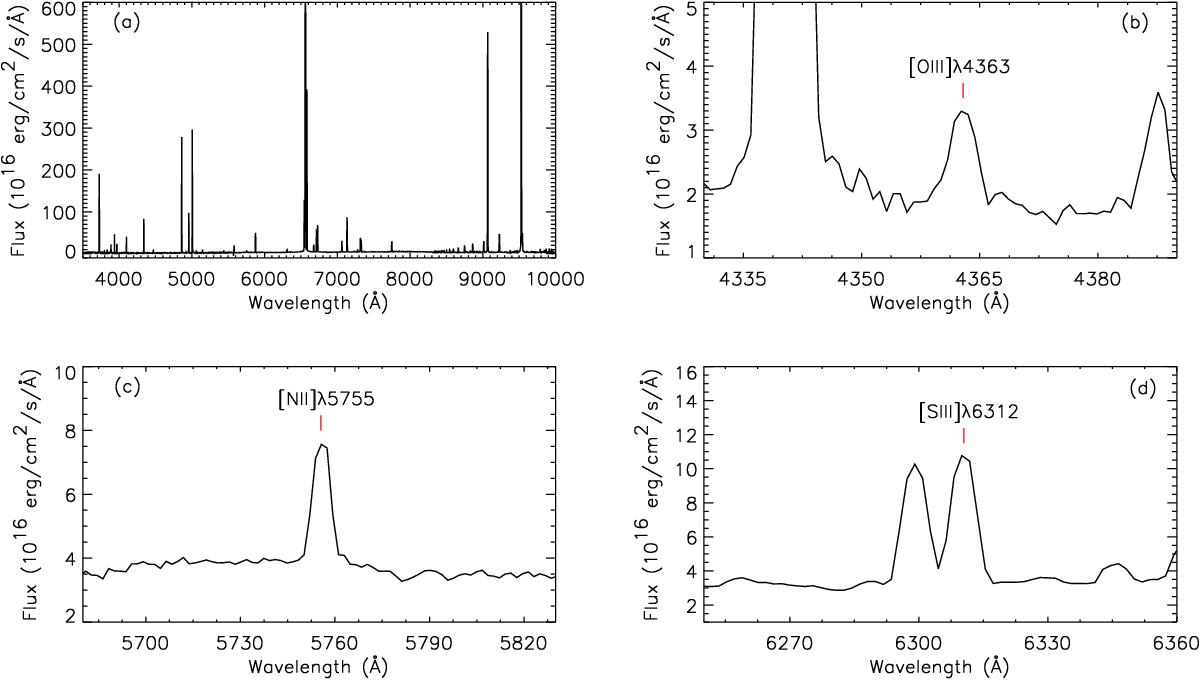
Extracted observed flux-calibrated spectra. From left to right and top to bottom: a) whole integrated spectrum of S156; b) subset of the spectrum of S162 showing the temperature sensitive line [O iii]λ4363; c) subset of the spectrum of S162 showing the temperature sensitive line [N ii]λ5755; and d) subset of the spectrum of S162 showing the temperature sensitive line [S iii]λ6312.
Current usage metrics show cumulative count of Article Views (full-text article views including HTML views, PDF and ePub downloads, according to the available data) and Abstracts Views on Vision4Press platform.
Data correspond to usage on the plateform after 2015. The current usage metrics is available 48-96 hours after online publication and is updated daily on week days.
Initial download of the metrics may take a while.