Free Access
Fig. 4
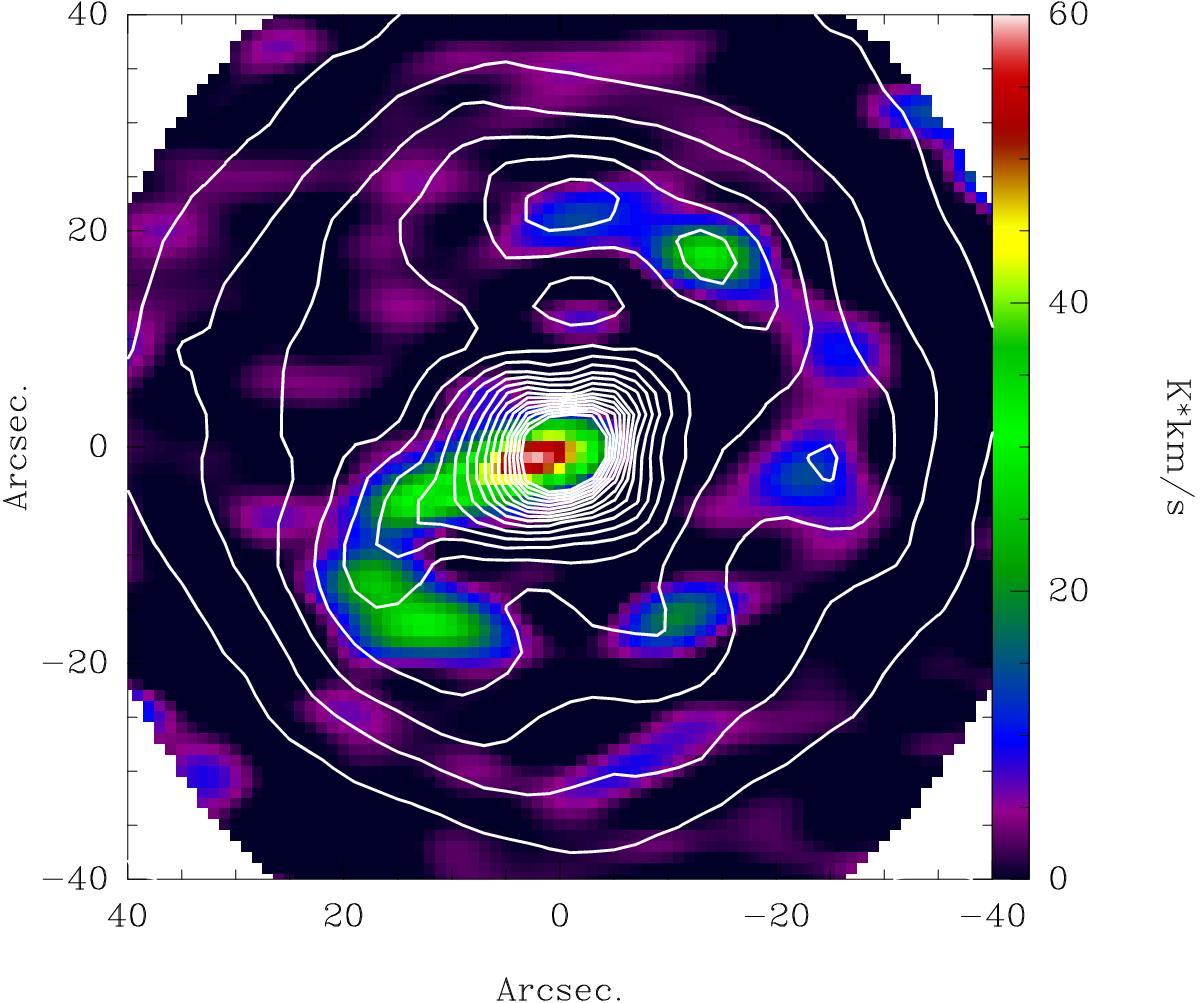
In color: ACA CO 2–1 emission integrated over the velocity range 0 to +140 km s-1 (avoiding the ISM contamination). Note that the emission peaks not at the star but on the spur feature. Overlaid in gray are Herschel 70 μm dust contours (see Hutsemékers et al. 2013).
Current usage metrics show cumulative count of Article Views (full-text article views including HTML views, PDF and ePub downloads, according to the available data) and Abstracts Views on Vision4Press platform.
Data correspond to usage on the plateform after 2015. The current usage metrics is available 48-96 hours after online publication and is updated daily on week days.
Initial download of the metrics may take a while.