Fig. 4
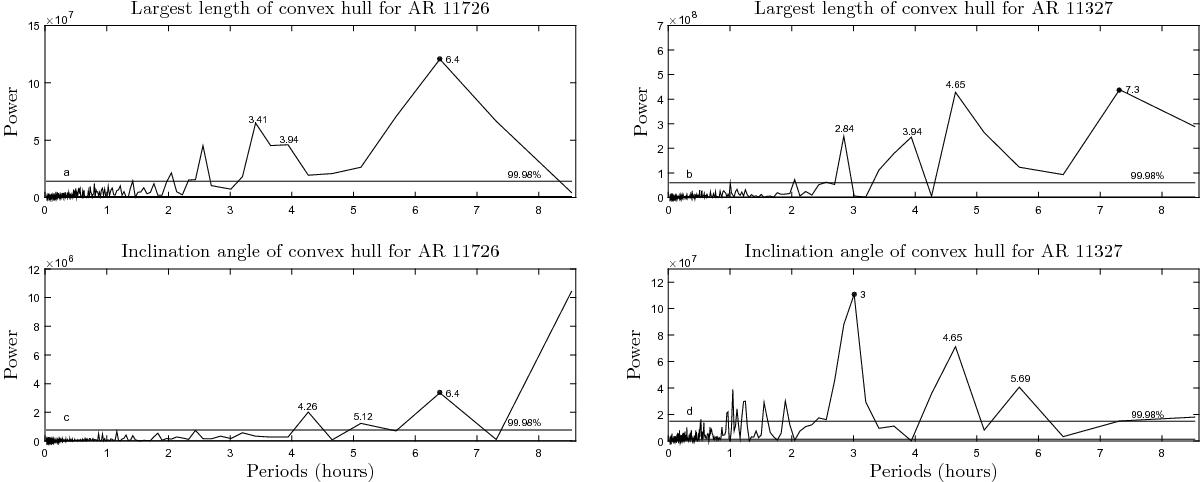
FFT analysis of the oscillations of the parameters of the convex hull, for ARs 11726 (left panels) and 11327 (right panels), respectively. The vertical line indicates the spectral power. The horizontal axis indicates the periods of oscillation (in hours). Here we removed the highest peaks, corresponding to 12 and 24-h instrumental periodicities.
Current usage metrics show cumulative count of Article Views (full-text article views including HTML views, PDF and ePub downloads, according to the available data) and Abstracts Views on Vision4Press platform.
Data correspond to usage on the plateform after 2015. The current usage metrics is available 48-96 hours after online publication and is updated daily on week days.
Initial download of the metrics may take a while.