Fig. 9
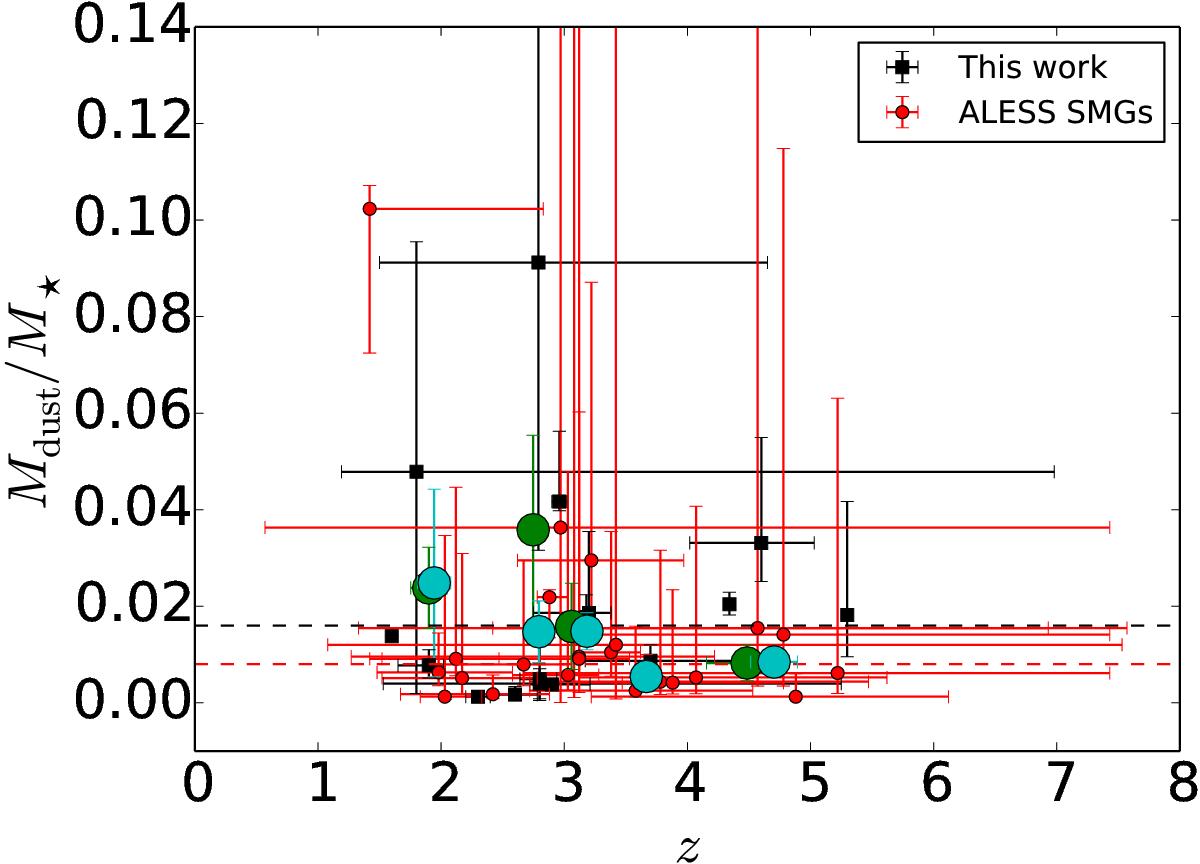
Dust-to-stellar mass ratio as a function of redshift for our SMGs and the flux-limited ALESS SMGs. The green filled circles represent the mean values of the binned AzTEC data (each bin contains four SMGs), while the cyan filled circles represent the mean values of the binned ALESS data (each bin contains five SMGs). The error bars of the binned data points represent the standard errors of the mean values. The horizontal dashed lines indicate the corresponding median values of ![]() and
and ![]() , respectively.
, respectively.
Current usage metrics show cumulative count of Article Views (full-text article views including HTML views, PDF and ePub downloads, according to the available data) and Abstracts Views on Vision4Press platform.
Data correspond to usage on the plateform after 2015. The current usage metrics is available 48-96 hours after online publication and is updated daily on week days.
Initial download of the metrics may take a while.