Fig. 8
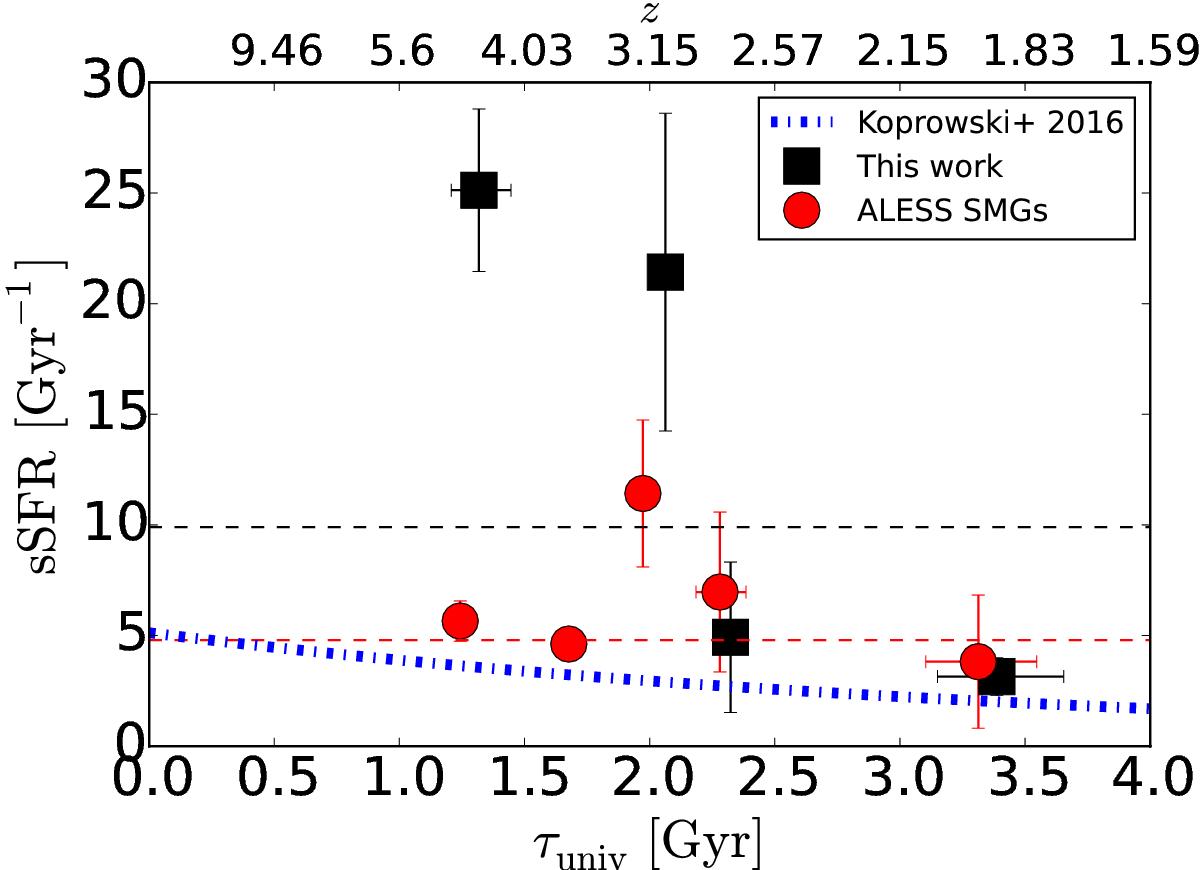
Specific SFR (sSFR) as a function of cosmic time (lower x-axis) and redshift (upper x-axis) for our SMGs and the flux-limited sample of ALESS SMGs. The plotted data points represent the mean values of our data and the ALESS SMG data binned in redshift and sSFR (each of our bin contains four sources, while the ALESS data have five values in each bin). The error bars represent the standard error of the mean. The horizontal dashed lines indicate the full sample median sSFRs of ![]() Gyr-1 and
Gyr-1 and ![]() Gyr-1, respectively. The blue dash-dotted line corresponds to the relationship log (sSFR/ Gyr-1) = −0.12 × (τuniv/ Gyr) + 0.71 derived by Koprowski et al. (2016).
Gyr-1, respectively. The blue dash-dotted line corresponds to the relationship log (sSFR/ Gyr-1) = −0.12 × (τuniv/ Gyr) + 0.71 derived by Koprowski et al. (2016).
Current usage metrics show cumulative count of Article Views (full-text article views including HTML views, PDF and ePub downloads, according to the available data) and Abstracts Views on Vision4Press platform.
Data correspond to usage on the plateform after 2015. The current usage metrics is available 48-96 hours after online publication and is updated daily on week days.
Initial download of the metrics may take a while.