Fig. 7
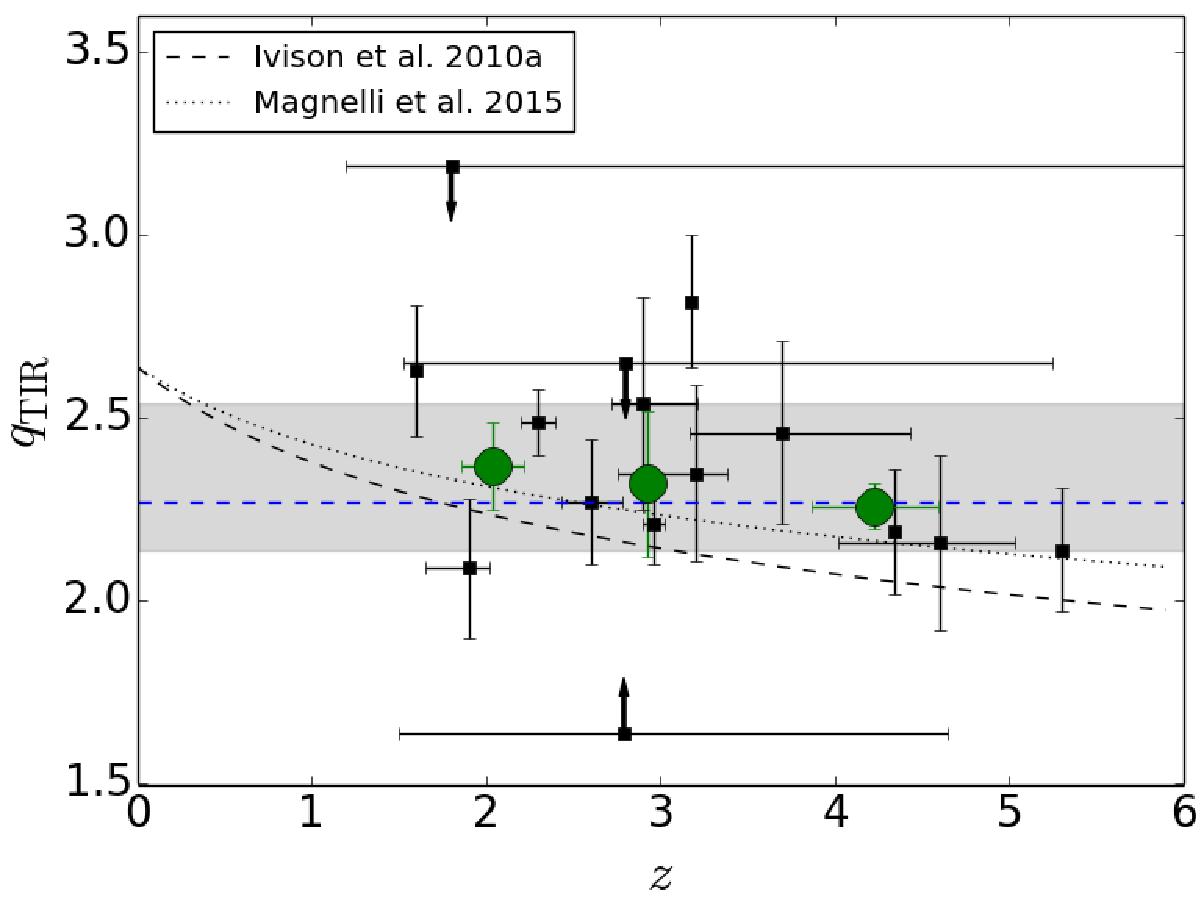
Infrared-radio correlation q ≡ qTIR parameter as a function of redshift. The arrows pointing up and down show the lower and upper limits, respectively. The green filled circles represent the survival analysis-based mean values of the binned data (each bin contains five SMGs) with the error bars showing the standard errors of the mean values. The blue dashed line indicates the median value of ![]() , and the quoted 16th–84th percentile range is illustrated by the grey shaded region. The black dashed curve shows the q(z) ∝ (1 + z)− 0.15 ± 0.03 relationship from Ivison et al. (2010a), while the dotted curve represents the q(z) ∝ (1 + z)− 0.12 ± 0.04 relationship from Magnelli et al. (2015). The latter relationships are normalised here to give a value of q = 2.64 at z = 0 (see Sect. 4.4).
, and the quoted 16th–84th percentile range is illustrated by the grey shaded region. The black dashed curve shows the q(z) ∝ (1 + z)− 0.15 ± 0.03 relationship from Ivison et al. (2010a), while the dotted curve represents the q(z) ∝ (1 + z)− 0.12 ± 0.04 relationship from Magnelli et al. (2015). The latter relationships are normalised here to give a value of q = 2.64 at z = 0 (see Sect. 4.4).
Current usage metrics show cumulative count of Article Views (full-text article views including HTML views, PDF and ePub downloads, according to the available data) and Abstracts Views on Vision4Press platform.
Data correspond to usage on the plateform after 2015. The current usage metrics is available 48-96 hours after online publication and is updated daily on week days.
Initial download of the metrics may take a while.