Fig. 4
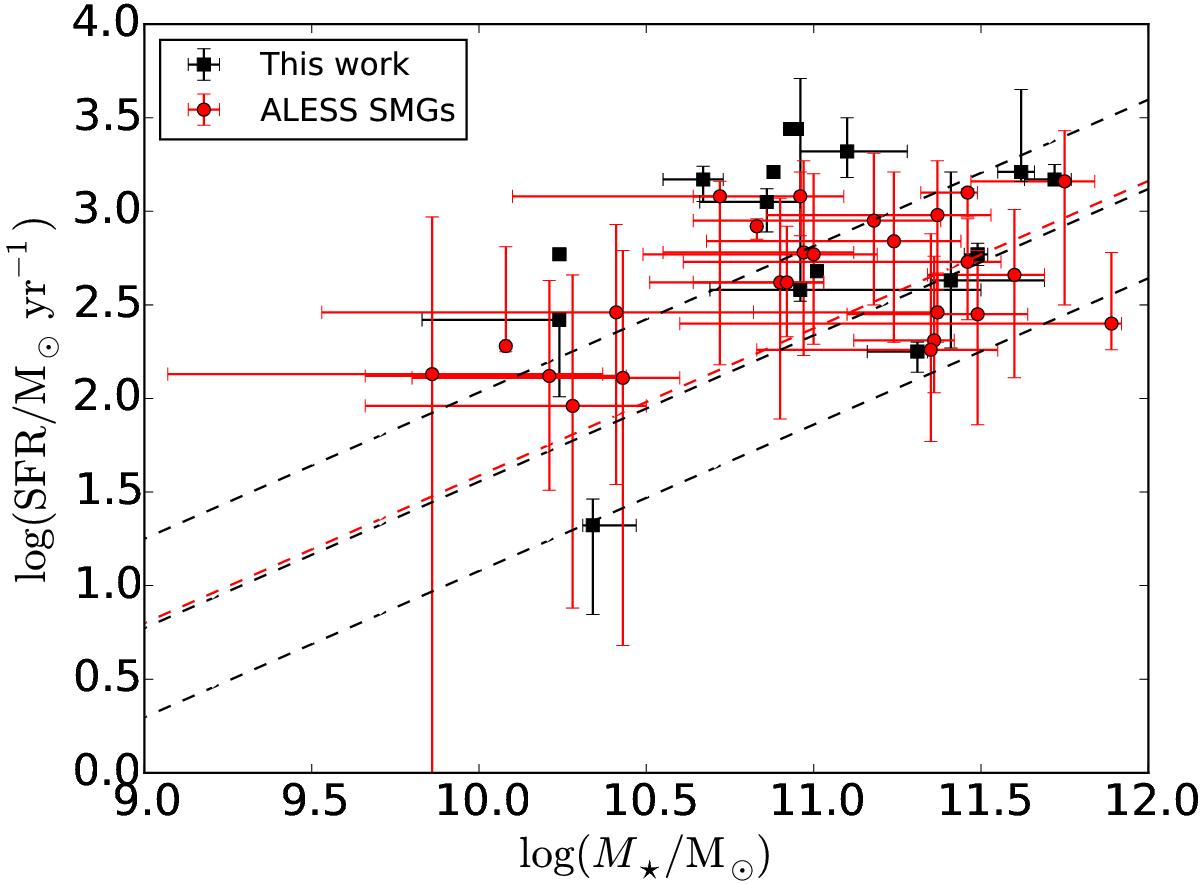
Log-log plot of the SFR vs. stellar mass. The black squares show our AzTEC SMG data points, while the red filled circles show the ALESS SMG data from da Cunha et al. (2015), where the ALESS sample was limited to sources with similar flux densities as our sample (see Sect. 4.2 for details). The dashed lines show the position of the star-forming main sequence at the median redshift of the analysed AzTEC SMGs (z = 2.85; black line) and the flux-limited ALESS sample (z = 3.12; red line) as given by Speagle et al. (2014); the lower and upper black dashed lines indicate a factor of three below and above the main sequence at z = 2.85.
Current usage metrics show cumulative count of Article Views (full-text article views including HTML views, PDF and ePub downloads, according to the available data) and Abstracts Views on Vision4Press platform.
Data correspond to usage on the plateform after 2015. The current usage metrics is available 48-96 hours after online publication and is updated daily on week days.
Initial download of the metrics may take a while.