Fig. 3
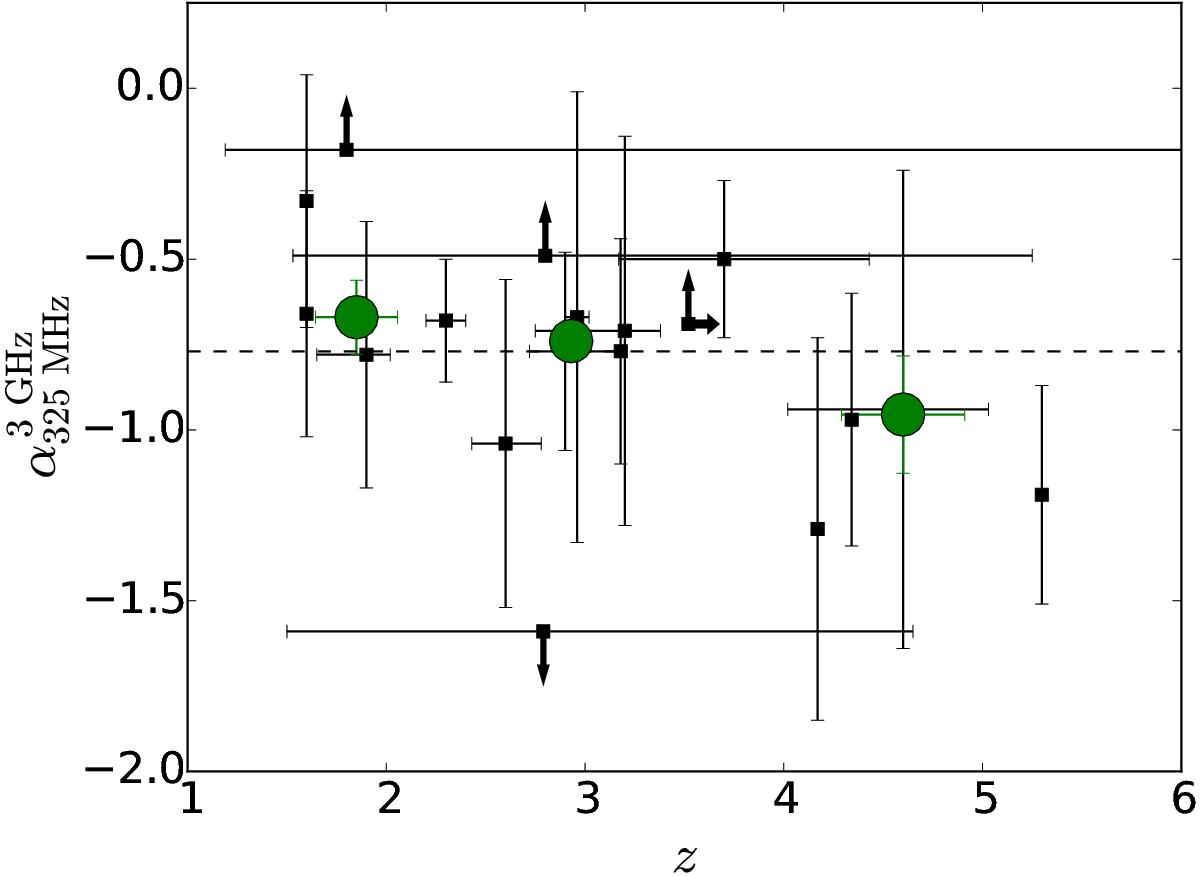
Radio spectral index between 325 MHz and 3 GHz as a function of redshift. The arrows indicate lower and upper limits to ![]() and z. The horizontal dashed line shows the median spectral index value of
and z. The horizontal dashed line shows the median spectral index value of ![]() . The green filled circles represent the median values of the binned data computed using survival analysis (each bin contains six SMGs), with the error bars showing the standard errors of the median values.
. The green filled circles represent the median values of the binned data computed using survival analysis (each bin contains six SMGs), with the error bars showing the standard errors of the median values.
Current usage metrics show cumulative count of Article Views (full-text article views including HTML views, PDF and ePub downloads, according to the available data) and Abstracts Views on Vision4Press platform.
Data correspond to usage on the plateform after 2015. The current usage metrics is available 48-96 hours after online publication and is updated daily on week days.
Initial download of the metrics may take a while.