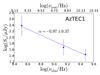
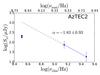
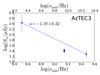
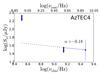
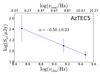
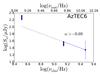
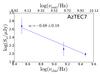
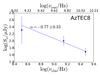
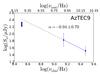
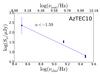
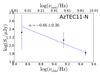
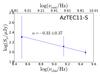
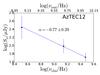
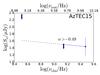
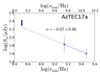
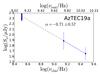
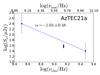
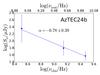
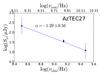
Fig. 2
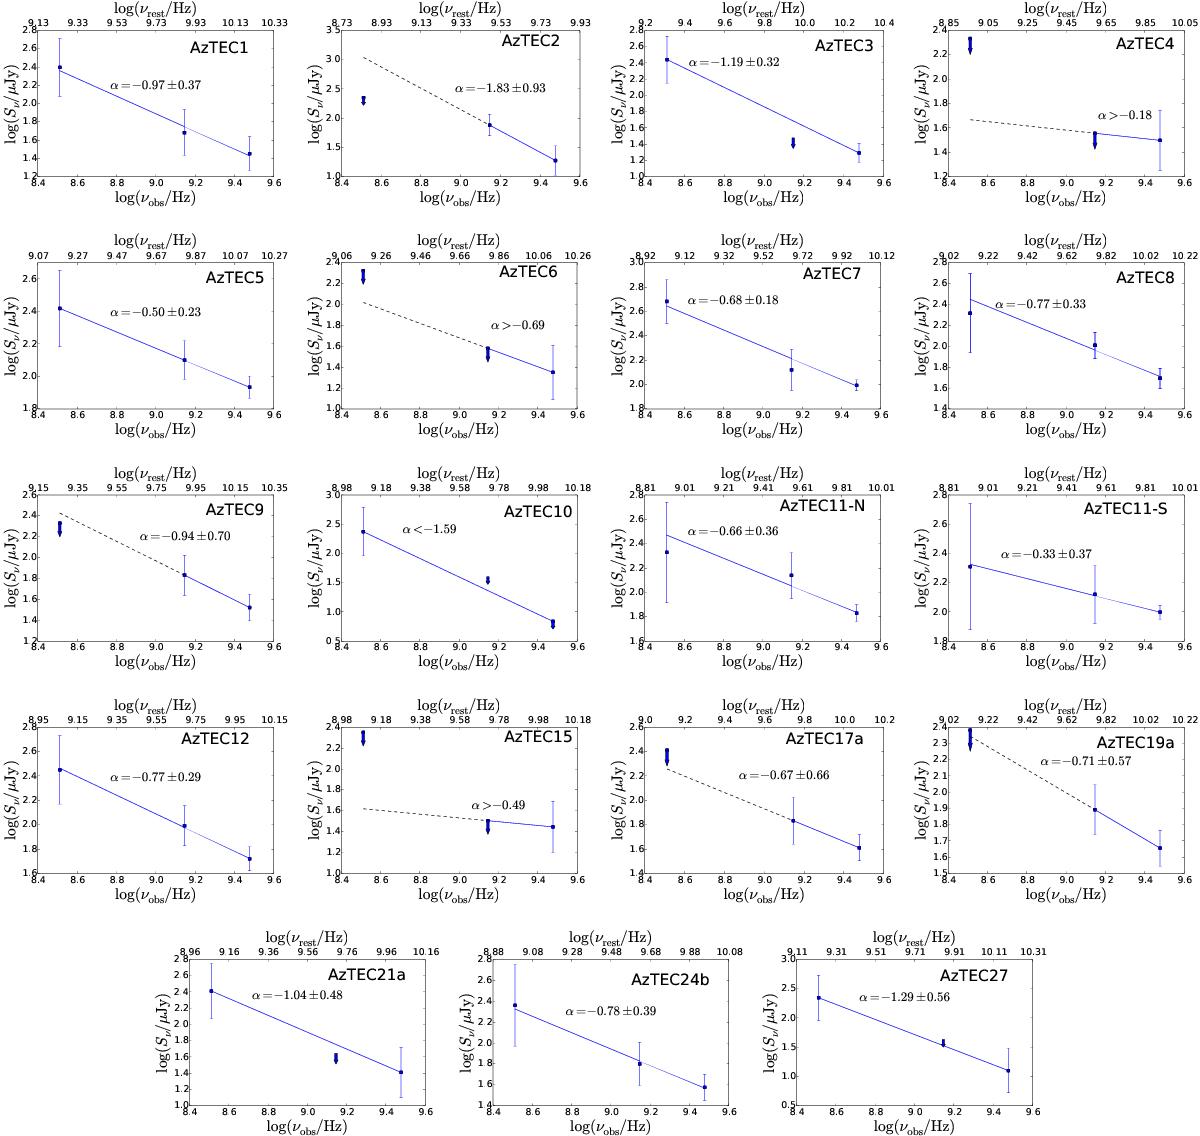
Radio SEDs (on a log-log scale) of 19 of our target SMGs that were detected in at least one of the three observed frequencies of 325 MHz, 1.4 GHz, and 3 GHz (the three data points in each panel with vertical error bars). The downwards pointing arrows show 3σ upper limits. The solid lines show the least squares fits to the data points, and the continuation of the fit is illustrated by the dashed line. The derived spectral index values are shown in each panel. In each panel, the lower x-axis shows the observed frequency, while the upper x-axis gives the corresponding rest-frame frequency (for AzTEC 6 and 27, only a lower z limit is available and, hence, the νrest shown is only a lower limit).
Current usage metrics show cumulative count of Article Views (full-text article views including HTML views, PDF and ePub downloads, according to the available data) and Abstracts Views on Vision4Press platform.
Data correspond to usage on the plateform after 2015. The current usage metrics is available 48-96 hours after online publication and is updated daily on week days.
Initial download of the metrics may take a while.