Fig. 10
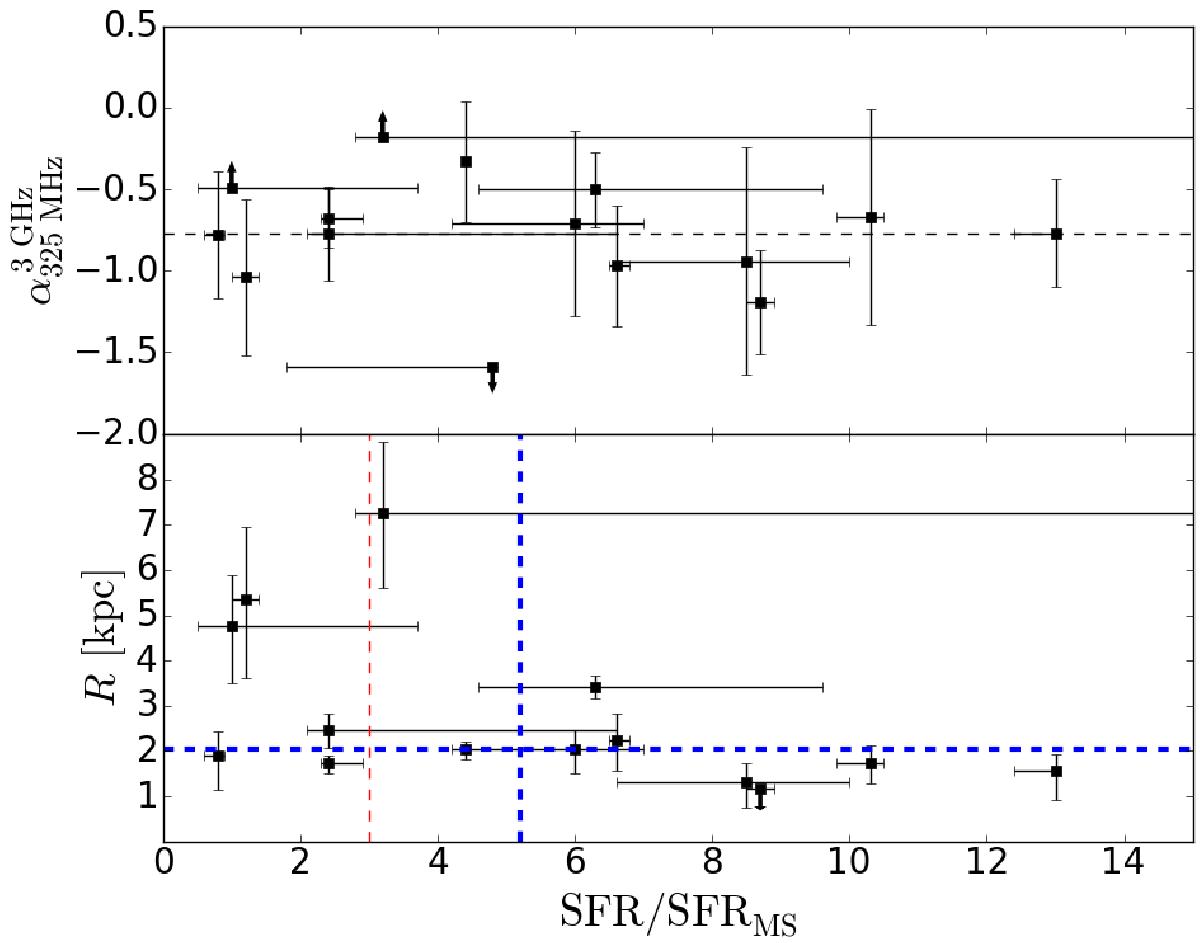
Top: radio spectral index between 325 MHz and 3 GHz as a function of starburstiness or the distance from the main sequence (parameterised as SFR/SFRMS). For reference, the horizontal dashed line indicates the median spectral index value of ![]() (see Table 3). Bottom: 3 GHz radio size (radius calculated as θmaj(FWHM)/2) from Paper II as a function of the distance above the main sequence. The blue vertical dashed line indicates the median value of SFR/SFRMS = 5.2 derived for the plotted sample, while the horizontal line indicates the survival analysis-based median radius of 2.03 kpc for the plotted sample. The thin, red vertical dashed line shows the upper boundary limit of the main sequence, i.e. SFR/SFRMS = 3.
(see Table 3). Bottom: 3 GHz radio size (radius calculated as θmaj(FWHM)/2) from Paper II as a function of the distance above the main sequence. The blue vertical dashed line indicates the median value of SFR/SFRMS = 5.2 derived for the plotted sample, while the horizontal line indicates the survival analysis-based median radius of 2.03 kpc for the plotted sample. The thin, red vertical dashed line shows the upper boundary limit of the main sequence, i.e. SFR/SFRMS = 3.
Current usage metrics show cumulative count of Article Views (full-text article views including HTML views, PDF and ePub downloads, according to the available data) and Abstracts Views on Vision4Press platform.
Data correspond to usage on the plateform after 2015. The current usage metrics is available 48-96 hours after online publication and is updated daily on week days.
Initial download of the metrics may take a while.