Free Access
Fig. 9
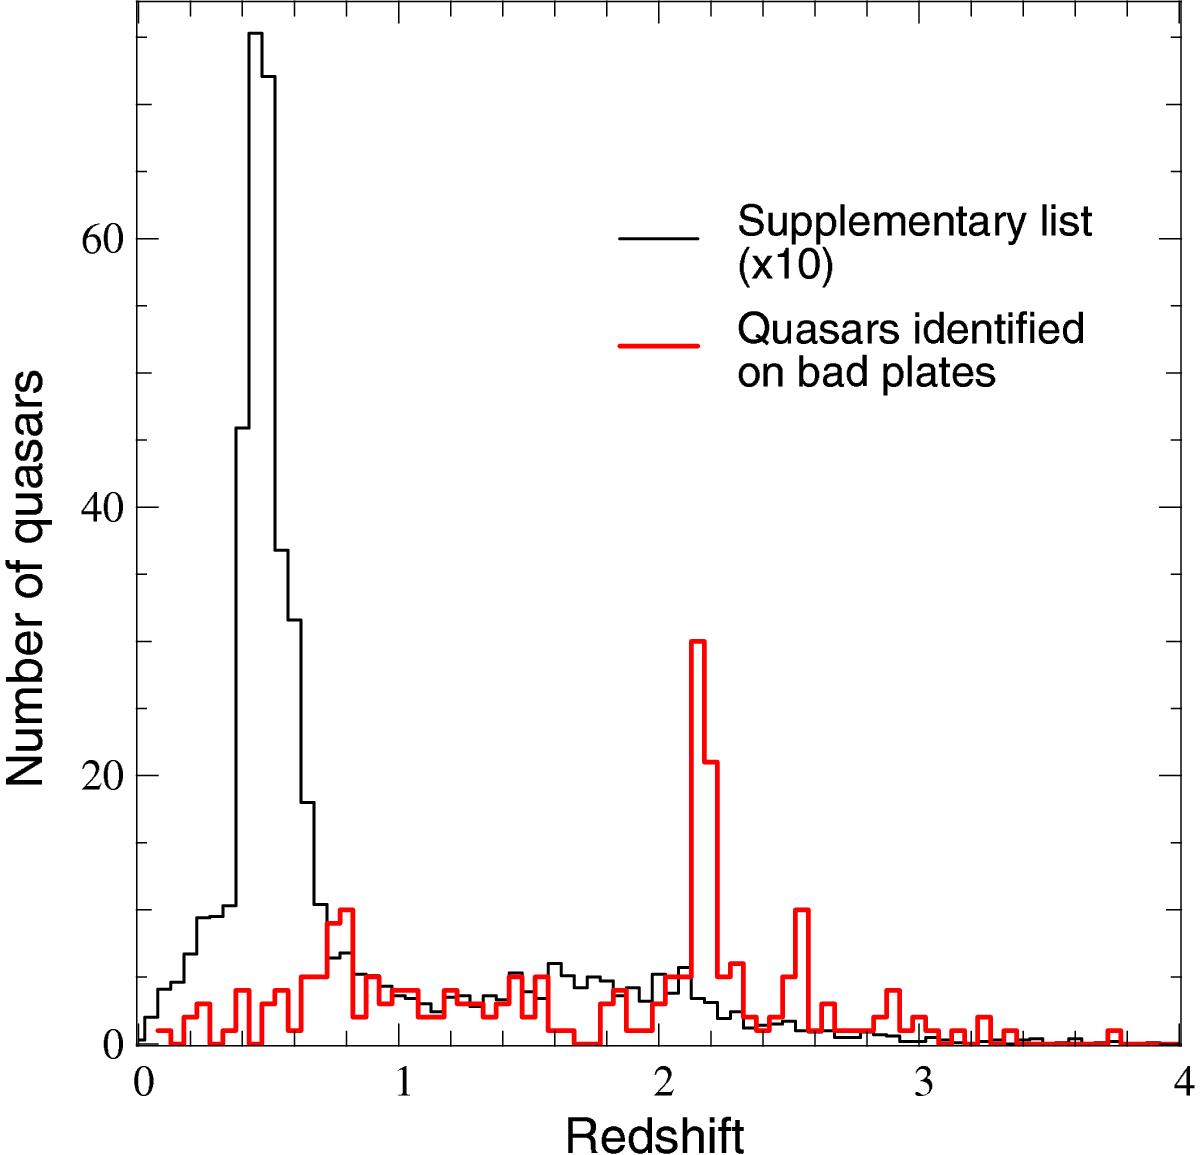
Redshift distribution of quasars serendipitously identified quasars (black histogram) and identified on bad plates (red histogram). The number of objects for the black histogram is divided by 10 for clarity.
Current usage metrics show cumulative count of Article Views (full-text article views including HTML views, PDF and ePub downloads, according to the available data) and Abstracts Views on Vision4Press platform.
Data correspond to usage on the plateform after 2015. The current usage metrics is available 48-96 hours after online publication and is updated daily on week days.
Initial download of the metrics may take a while.