Fig. 8
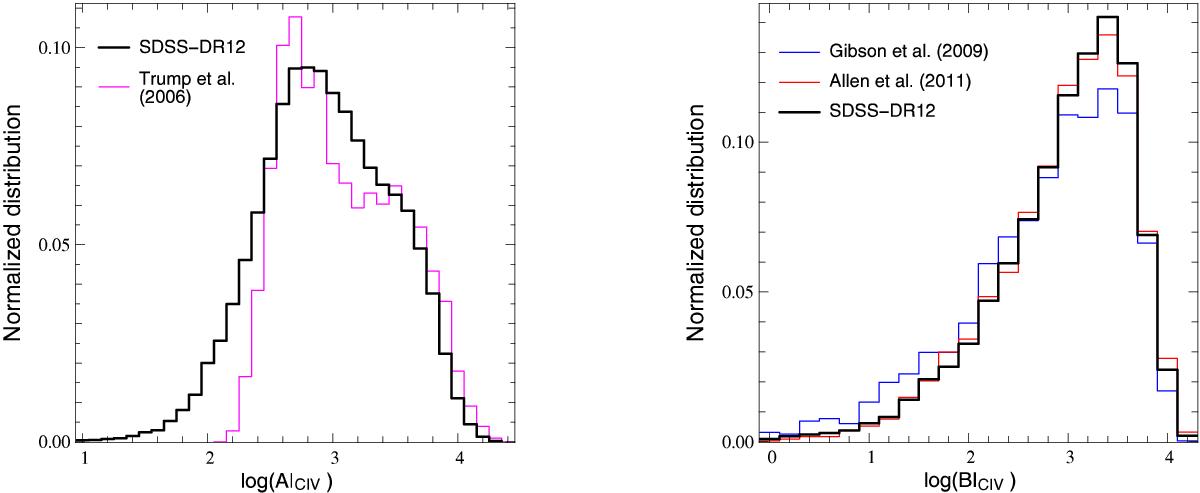
Left panel: distribution of AI for the SDSS-DR3 (magenta histogram; Trump et al. 2006) and the SDSS-DR12 (black histogram) quasars. Both distributions are normalized to have a surface area equal to 1 for log AI > 2.5. Right panel: distribution of BI from the DR12Q catalog (black histogram), from the SDSS-DR6 (red histogram; Allen et al. 2011) and from the SDSS-DR5 (blue histogram; Gibson et al. 2009). All the distributions are normalized to have their sum equal to 1.
Current usage metrics show cumulative count of Article Views (full-text article views including HTML views, PDF and ePub downloads, according to the available data) and Abstracts Views on Vision4Press platform.
Data correspond to usage on the plateform after 2015. The current usage metrics is available 48-96 hours after online publication and is updated daily on week days.
Initial download of the metrics may take a while.