Fig. 5
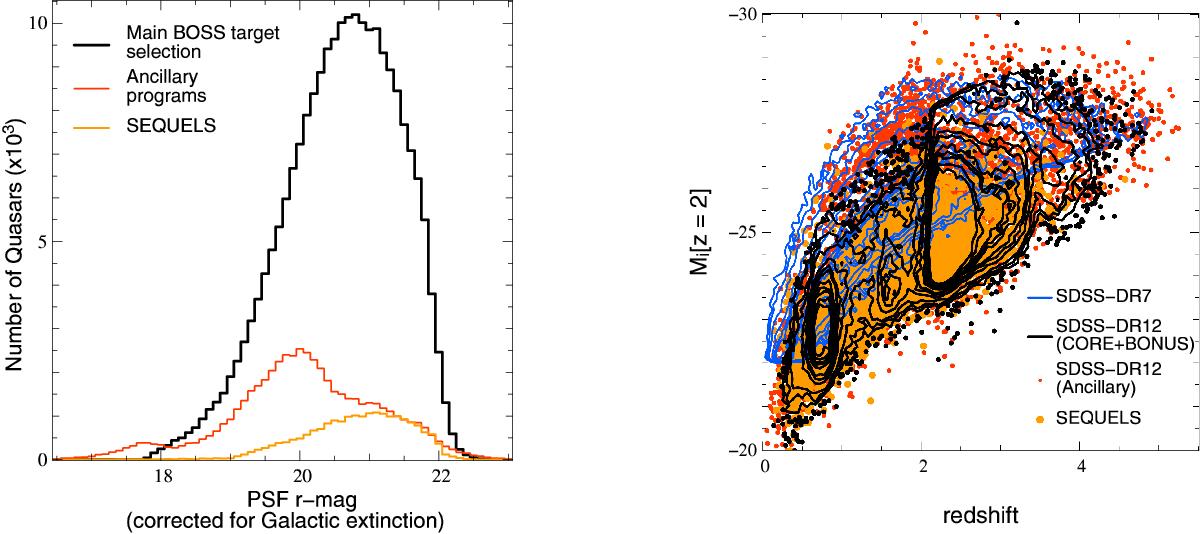
Left panel: distribution of r PSF magnitude (corrected for Galactic extinction) for the BOSS main sample (selected by the algorithms described in Ross et al. 2012,thick black histogram), ancillary programs (red histogram) and SEQUELS (orange histogram). The bin size is Δr = 0.02. Right panel: absolute magnitude-redshift plane for SDSS-DR12 CORE+BONUS quasars (black contours), quasars observed as part of SDSS-DR12 ancillary programs (red points), SEQUELS quasars (orange points) and SDSS-DR7 quasars (blue contours). The absolute magnitudes assume H0 = 70 km s-1 Mpc-1 and the K-correction is given by Richards et al. (2006), who define K(z = 2) = 0. Contours are drawn at constant point density.
Current usage metrics show cumulative count of Article Views (full-text article views including HTML views, PDF and ePub downloads, according to the available data) and Abstracts Views on Vision4Press platform.
Data correspond to usage on the plateform after 2015. The current usage metrics is available 48-96 hours after online publication and is updated daily on week days.
Initial download of the metrics may take a while.