Fig. 4
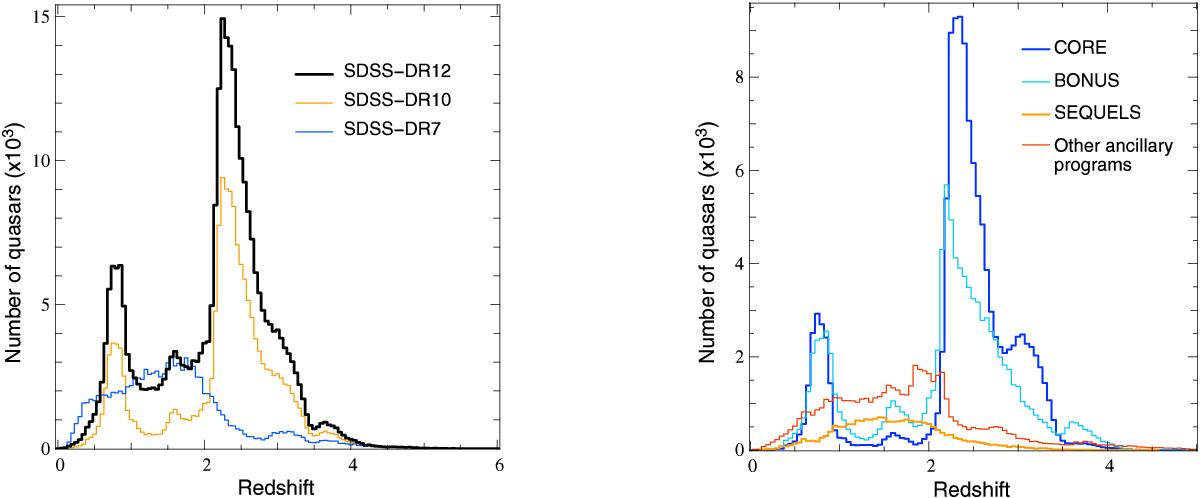
Left panel: redshift distribution of the SDSS-DR12 (thick black histogram), SDSS-DR10 (orange histogram) and SDSS-DR7 (blue histogram) quasars over the redshift range 0–6. Right panel: redshift distribution of the SDSS-DR12 quasars for the CORE sample (dark blue histogram), BONUS sample (light blue histogram), ancillary programs (red histogram) and SEQUELS (orange histogram). The bin size of all the histograms is Δz = 0.05. The two peaks at z ~ 0.8 and z ~ 1.6 seen in the redshift distribution of the SDSS-DR10 and SDSS-DR12 quasar samples (left panel) and in the distribution of the CORE and BONUS samples (right panel) are due to known degeneracies in the quasar target selection (see Ross et al. 2012,for details).
Current usage metrics show cumulative count of Article Views (full-text article views including HTML views, PDF and ePub downloads, according to the available data) and Abstracts Views on Vision4Press platform.
Data correspond to usage on the plateform after 2015. The current usage metrics is available 48-96 hours after online publication and is updated daily on week days.
Initial download of the metrics may take a while.