Free Access
Fig. 3
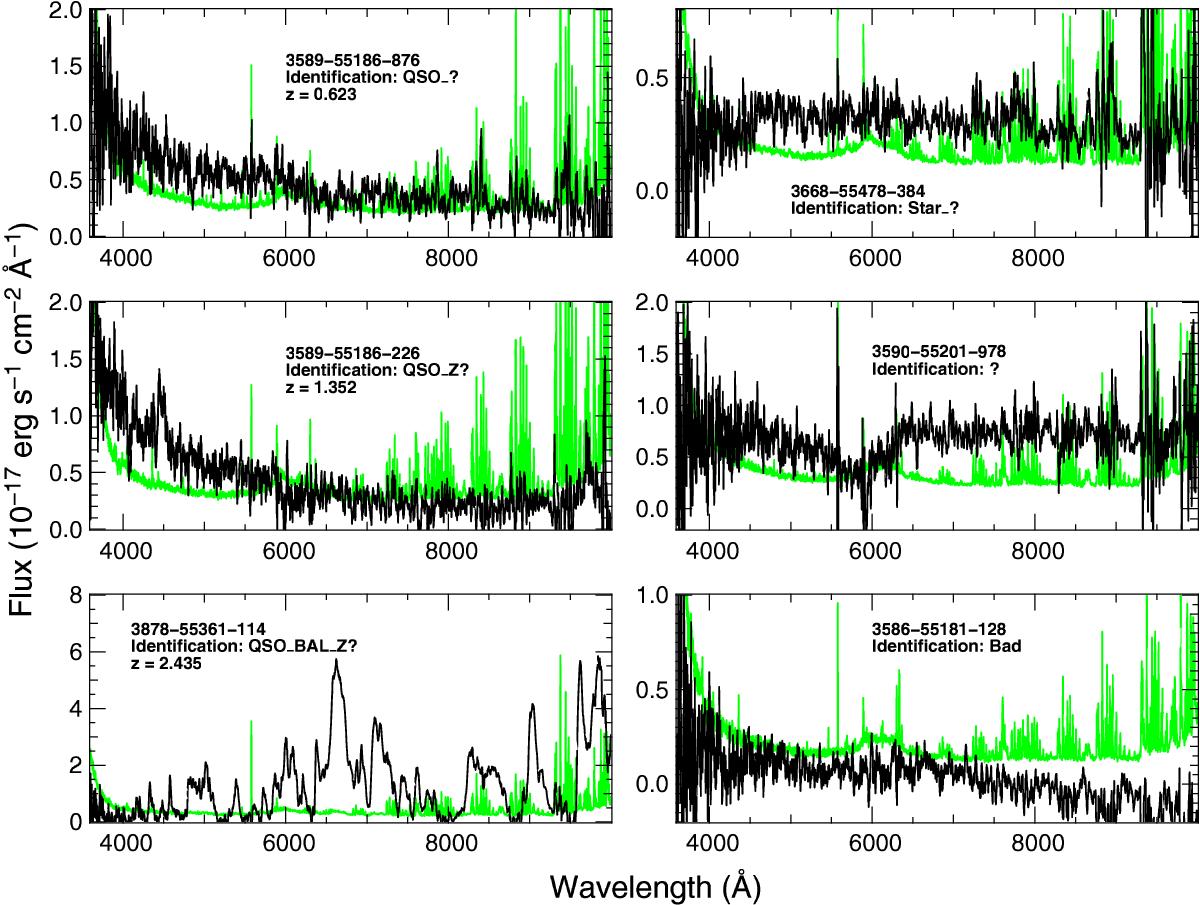
Examples of spectra identified as QSO_? (top left), QSO_Z? (middle left), QSO_BAL_Z? (bottom left), Star_? (top right), ? (middle right), and Bad (bottom right). The fluxes are shown in black and associated errors in green. All the spectra are smoothed over 10 pixels.
Current usage metrics show cumulative count of Article Views (full-text article views including HTML views, PDF and ePub downloads, according to the available data) and Abstracts Views on Vision4Press platform.
Data correspond to usage on the plateform after 2015. The current usage metrics is available 48-96 hours after online publication and is updated daily on week days.
Initial download of the metrics may take a while.