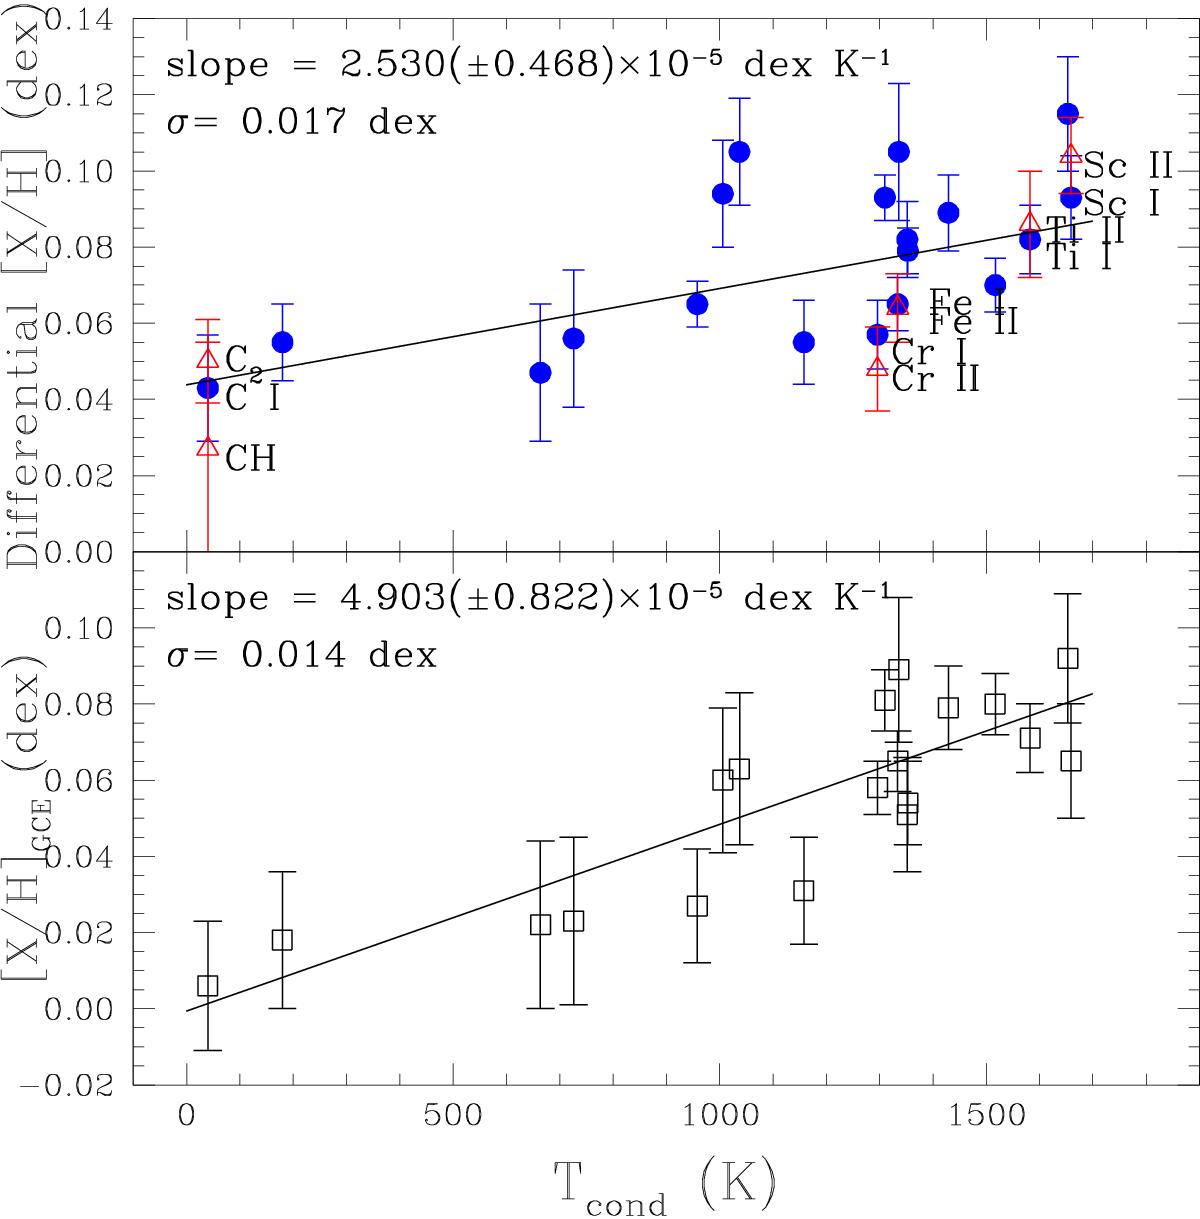
Fig. 7

Upper panel: observed abundance pattern of HIP 68468 versus condensation temperature before GCE corrections. The solid line is a fit taking into account the total error bars. It has a significance of 5.4σ, and the element-to-element scatter from the fit is 0.017 dex, which is larger than the average error bar (0.012 dex). Lower panel: abundance pattern after GCE corrections to the solar age. The error bars also include the error of the GCE corrections, and has an average of 0.014 dex. The correlation with condensation temperature is now stronger and more significant (6.0σ), and the element-to-element scatter about the fit (0.014 dex) is in perfect agreement with the average error bar.
Current usage metrics show cumulative count of Article Views (full-text article views including HTML views, PDF and ePub downloads, according to the available data) and Abstracts Views on Vision4Press platform.
Data correspond to usage on the plateform after 2015. The current usage metrics is available 48-96 hours after online publication and is updated daily on week days.
Initial download of the metrics may take a while.


