Free Access
Fig. 4
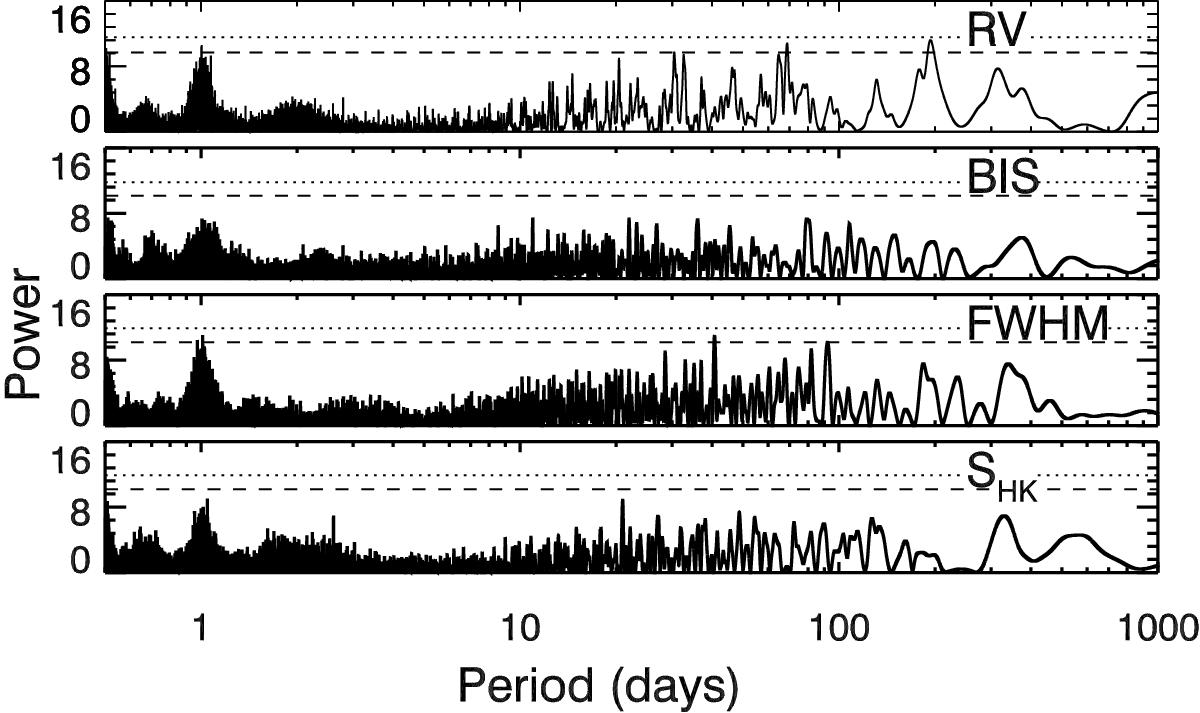
GLS periodograms of the RV data and various activity indicators for comparison. Horizontal lines correspond to false-alarm probabilities of 10% (dashed) and 1% (dotted), as calculated from bootstrap Monte Carlo resampling.
Current usage metrics show cumulative count of Article Views (full-text article views including HTML views, PDF and ePub downloads, according to the available data) and Abstracts Views on Vision4Press platform.
Data correspond to usage on the plateform after 2015. The current usage metrics is available 48-96 hours after online publication and is updated daily on week days.
Initial download of the metrics may take a while.