Fig. 2
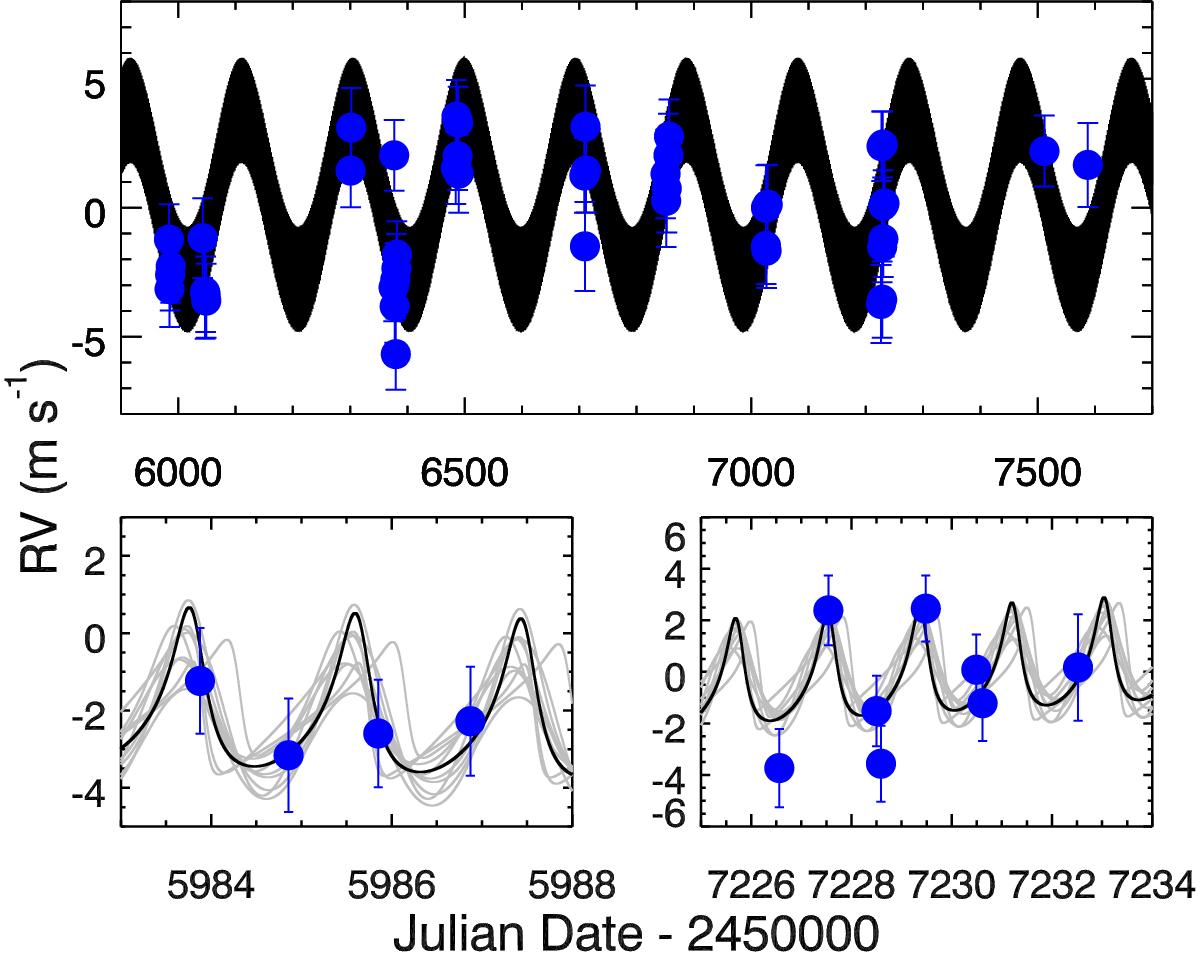
Full time series of RV data (blue) and two-planet best-fit model. The two lower panels show zoomed-in subsets of the time series. The black line is the best-fit model from a least-squares fit. The grey lines are models randomly drawn from the one-sigma range of best steps in the MCMC analysis. As illustrated by the grey models, the eccentricity of the inner planet is not well constrained.
Current usage metrics show cumulative count of Article Views (full-text article views including HTML views, PDF and ePub downloads, according to the available data) and Abstracts Views on Vision4Press platform.
Data correspond to usage on the plateform after 2015. The current usage metrics is available 48-96 hours after online publication and is updated daily on week days.
Initial download of the metrics may take a while.