Fig. 1
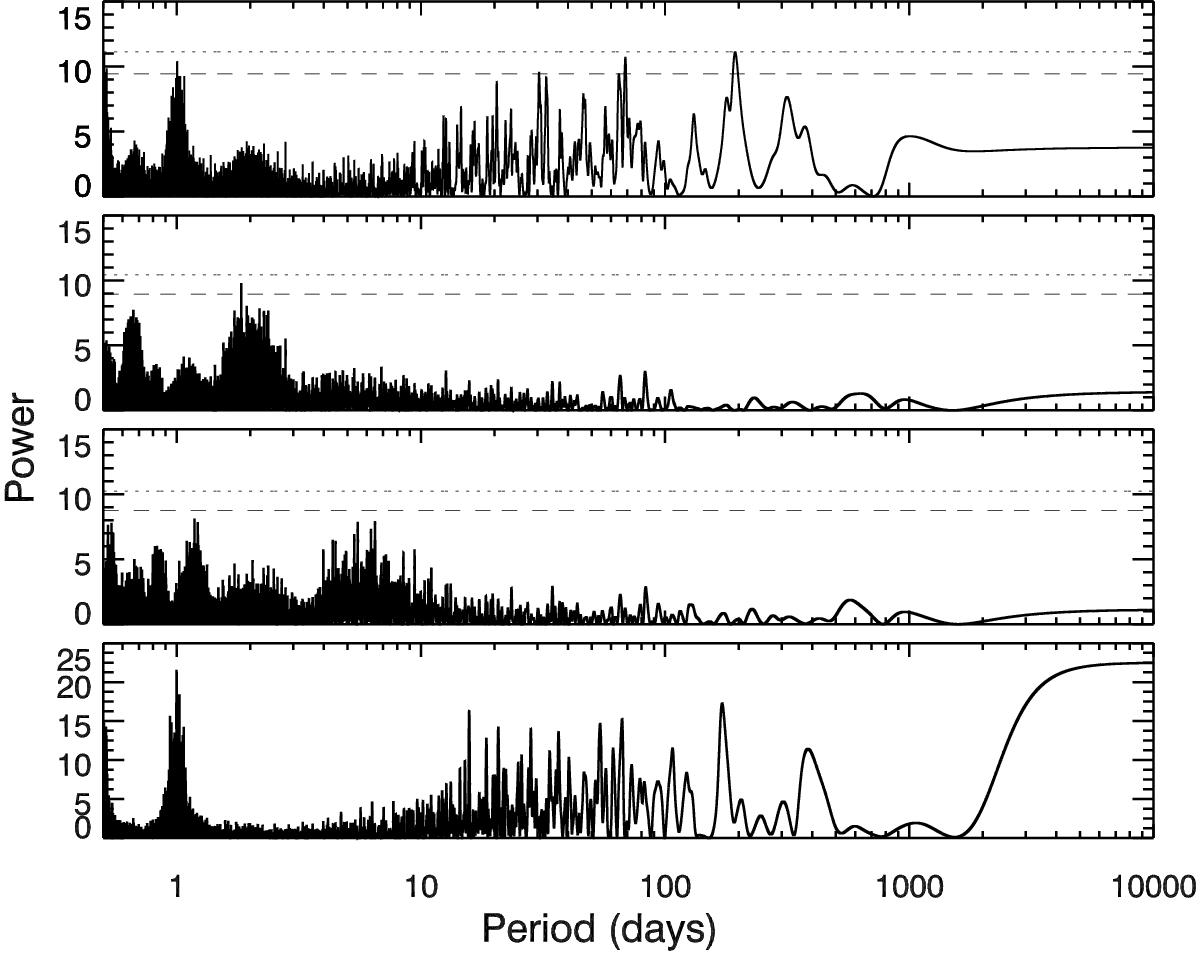
Generalised Lomb Scargle (GLS) periodograms to determine the frequencies of planet candidates. Top panel is a periodogram of the original data with instrumental upgrade offset removed. Middle panels are periodograms of the residuals to a 194-day Keplerian fit (upper middle) and a two-planet fit (lower middle). The horizontal lines represent false-alarm probability levels of 10% (dashed) and 1% (dotted), as calculated from a bootstrap Monte Carlo method. Also included for comparison is the window function of the sampling (bottom panel).
Current usage metrics show cumulative count of Article Views (full-text article views including HTML views, PDF and ePub downloads, according to the available data) and Abstracts Views on Vision4Press platform.
Data correspond to usage on the plateform after 2015. The current usage metrics is available 48-96 hours after online publication and is updated daily on week days.
Initial download of the metrics may take a while.