Free Access
Fig. 6

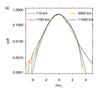
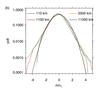
PDF of the velocity increments at separations of 110 km, 1100 km, 5500 km and 11000 km with the black line giving the distribution of a Gaussian PDF. Panels a) and b) given the distributions for horizontal and vertical separations respectively.
This figure is made of several images, please see below:
Current usage metrics show cumulative count of Article Views (full-text article views including HTML views, PDF and ePub downloads, according to the available data) and Abstracts Views on Vision4Press platform.
Data correspond to usage on the plateform after 2015. The current usage metrics is available 48-96 hours after online publication and is updated daily on week days.
Initial download of the metrics may take a while.