Free Access
Fig. 3
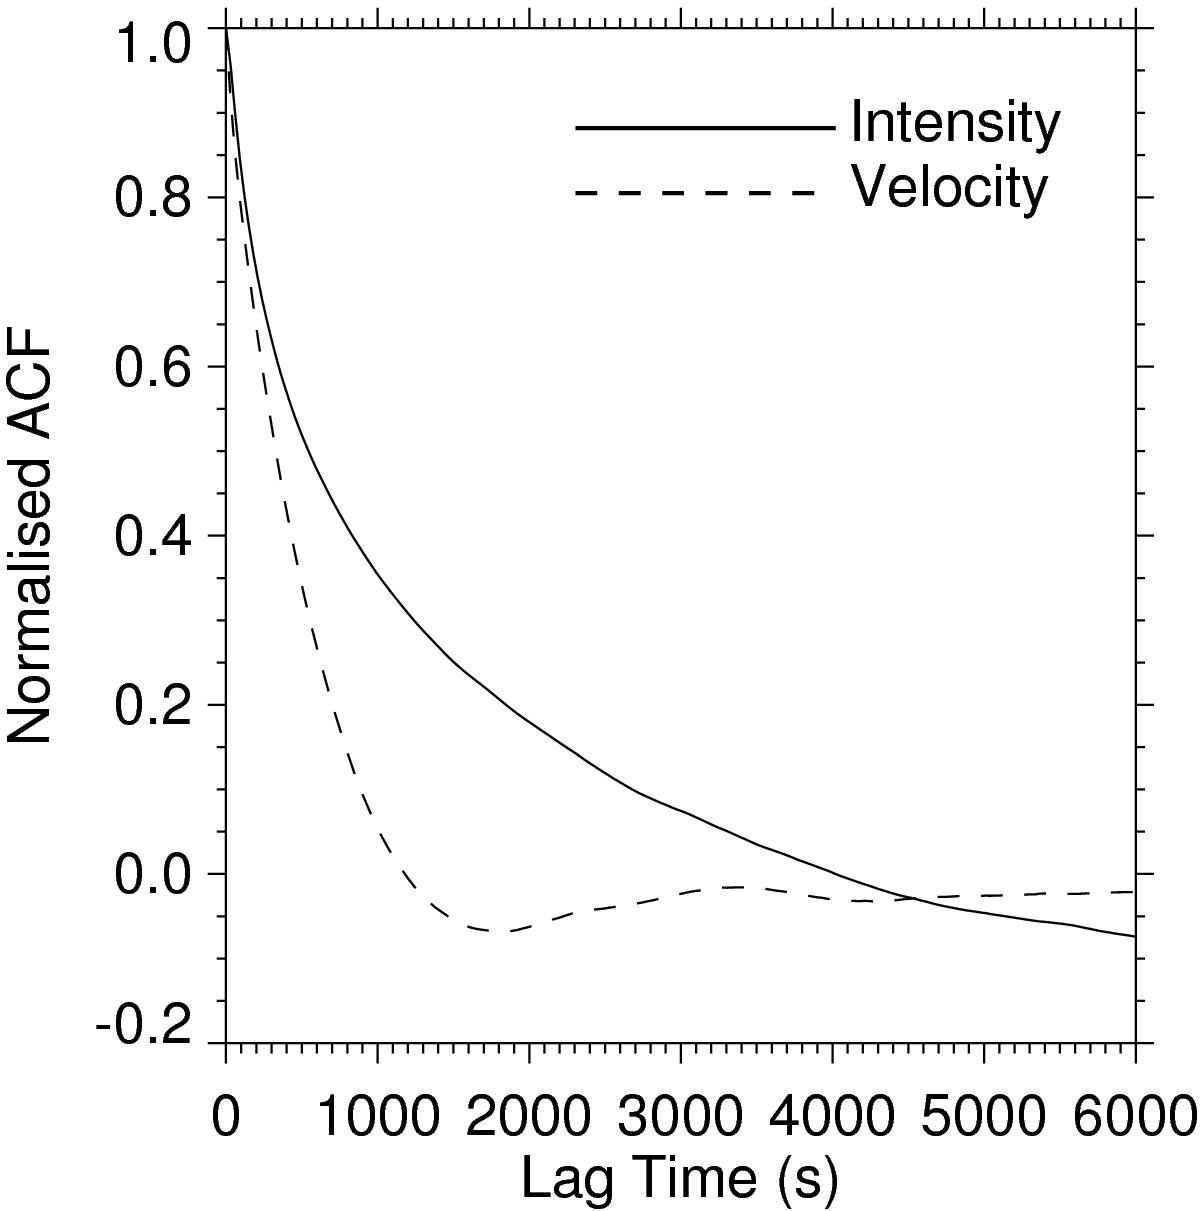
Normalised average at each lag of the auto-correlation function for all the pixels of the prominence for both the prominence intensity (solid line) and velocity fluctuations (dashed line).
Current usage metrics show cumulative count of Article Views (full-text article views including HTML views, PDF and ePub downloads, according to the available data) and Abstracts Views on Vision4Press platform.
Data correspond to usage on the plateform after 2015. The current usage metrics is available 48-96 hours after online publication and is updated daily on week days.
Initial download of the metrics may take a while.