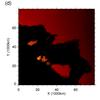
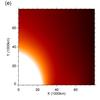
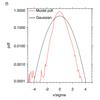
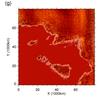
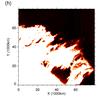
Fig. A.1
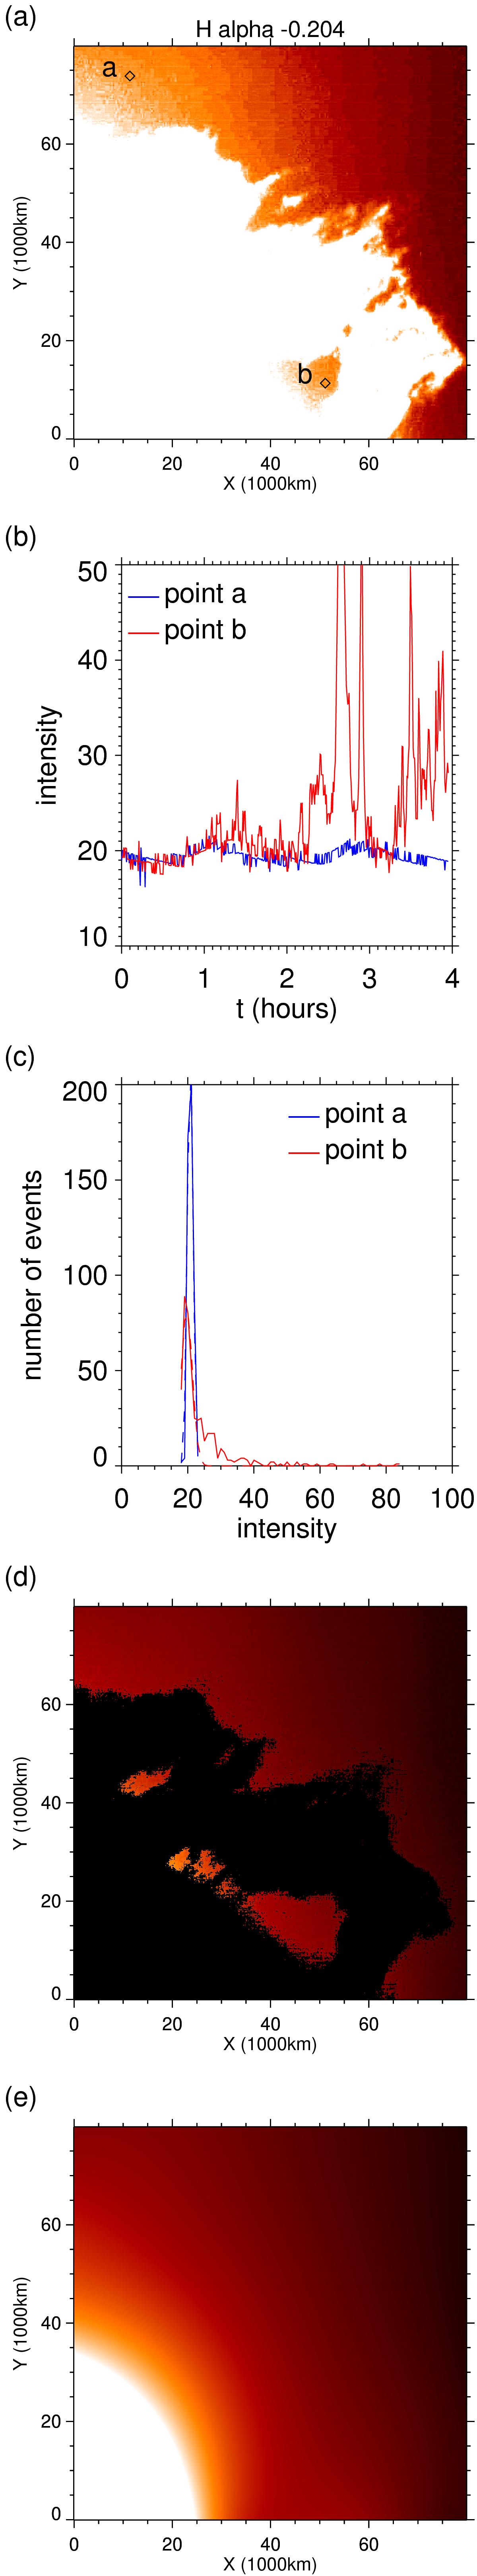
a) level 1 intensity (intensity range of 0 to 25); b) temporal variation of intensity at points a) and b); c) histograms of the intensities at points a) and b); d) the mean background value (intensity range of 0 to 25); e) the background model (intensity range of 0 to 50), f) the histogram of the model values minus the mean background; g) the 2D distribution of the difference between the model and mean background (colour range between −2 and 2 with white lines showing the boundary between regions with and without data) and h) the level 1 intensity minus the background model (intensity range of 0 to 25).
Current usage metrics show cumulative count of Article Views (full-text article views including HTML views, PDF and ePub downloads, according to the available data) and Abstracts Views on Vision4Press platform.
Data correspond to usage on the plateform after 2015. The current usage metrics is available 48-96 hours after online publication and is updated daily on week days.
Initial download of the metrics may take a while.