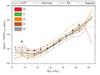
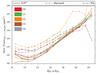
Fig. 7
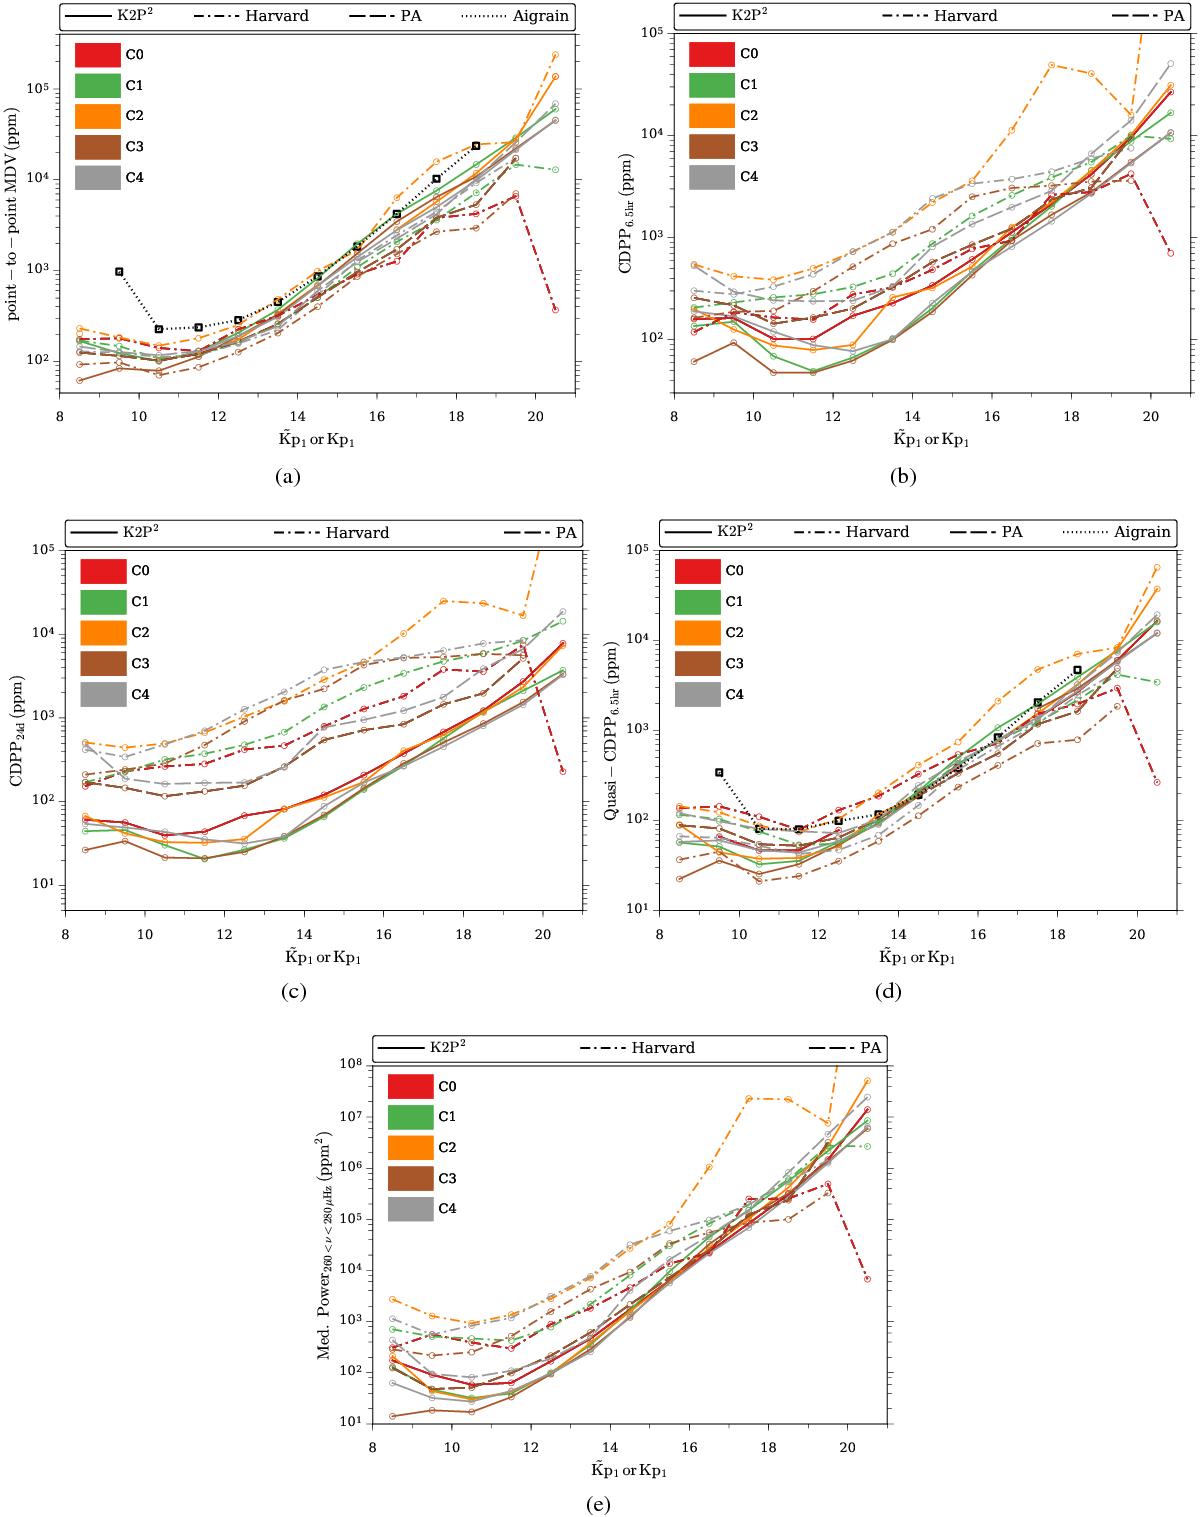
Comparison of photometric variability metrics between the K2P2, Harvard (C0–4), and PA (C3–4) pipelines as a function of Kp (![]() for K2P2). The metrics are depicted by their median magnitude-binned values. (1) Point-to-point median difference variability (MDV). (2) 24-day “long-CDPP” (see Gilliland et al. 2015). (3) 6.5-h CDPP, computed following Gilliland et al. (2011) (see text). Here we have included the lower envelope for the CDPP6.5h values computed in Gilliland et al. (2011) from nominal Kepler data. (4) Quasi-CDPP6.5 h as reported by Vanderburg & Johnson (2014) and Aigrain et al. (2015). For the point-to-point MDV and quasi-CDPP6.5h we have included the median binned values obtained by Aigrain et al. (2015) from engineering data and circular apertures with a 3-pixel radius. (5): Median levels of (unweighted) power spectra from corrected light curves between 260 and 280 μHz.
for K2P2). The metrics are depicted by their median magnitude-binned values. (1) Point-to-point median difference variability (MDV). (2) 24-day “long-CDPP” (see Gilliland et al. 2015). (3) 6.5-h CDPP, computed following Gilliland et al. (2011) (see text). Here we have included the lower envelope for the CDPP6.5h values computed in Gilliland et al. (2011) from nominal Kepler data. (4) Quasi-CDPP6.5 h as reported by Vanderburg & Johnson (2014) and Aigrain et al. (2015). For the point-to-point MDV and quasi-CDPP6.5h we have included the median binned values obtained by Aigrain et al. (2015) from engineering data and circular apertures with a 3-pixel radius. (5): Median levels of (unweighted) power spectra from corrected light curves between 260 and 280 μHz.
Current usage metrics show cumulative count of Article Views (full-text article views including HTML views, PDF and ePub downloads, according to the available data) and Abstracts Views on Vision4Press platform.
Data correspond to usage on the plateform after 2015. The current usage metrics is available 48-96 hours after online publication and is updated daily on week days.
Initial download of the metrics may take a while.