Fig. 2
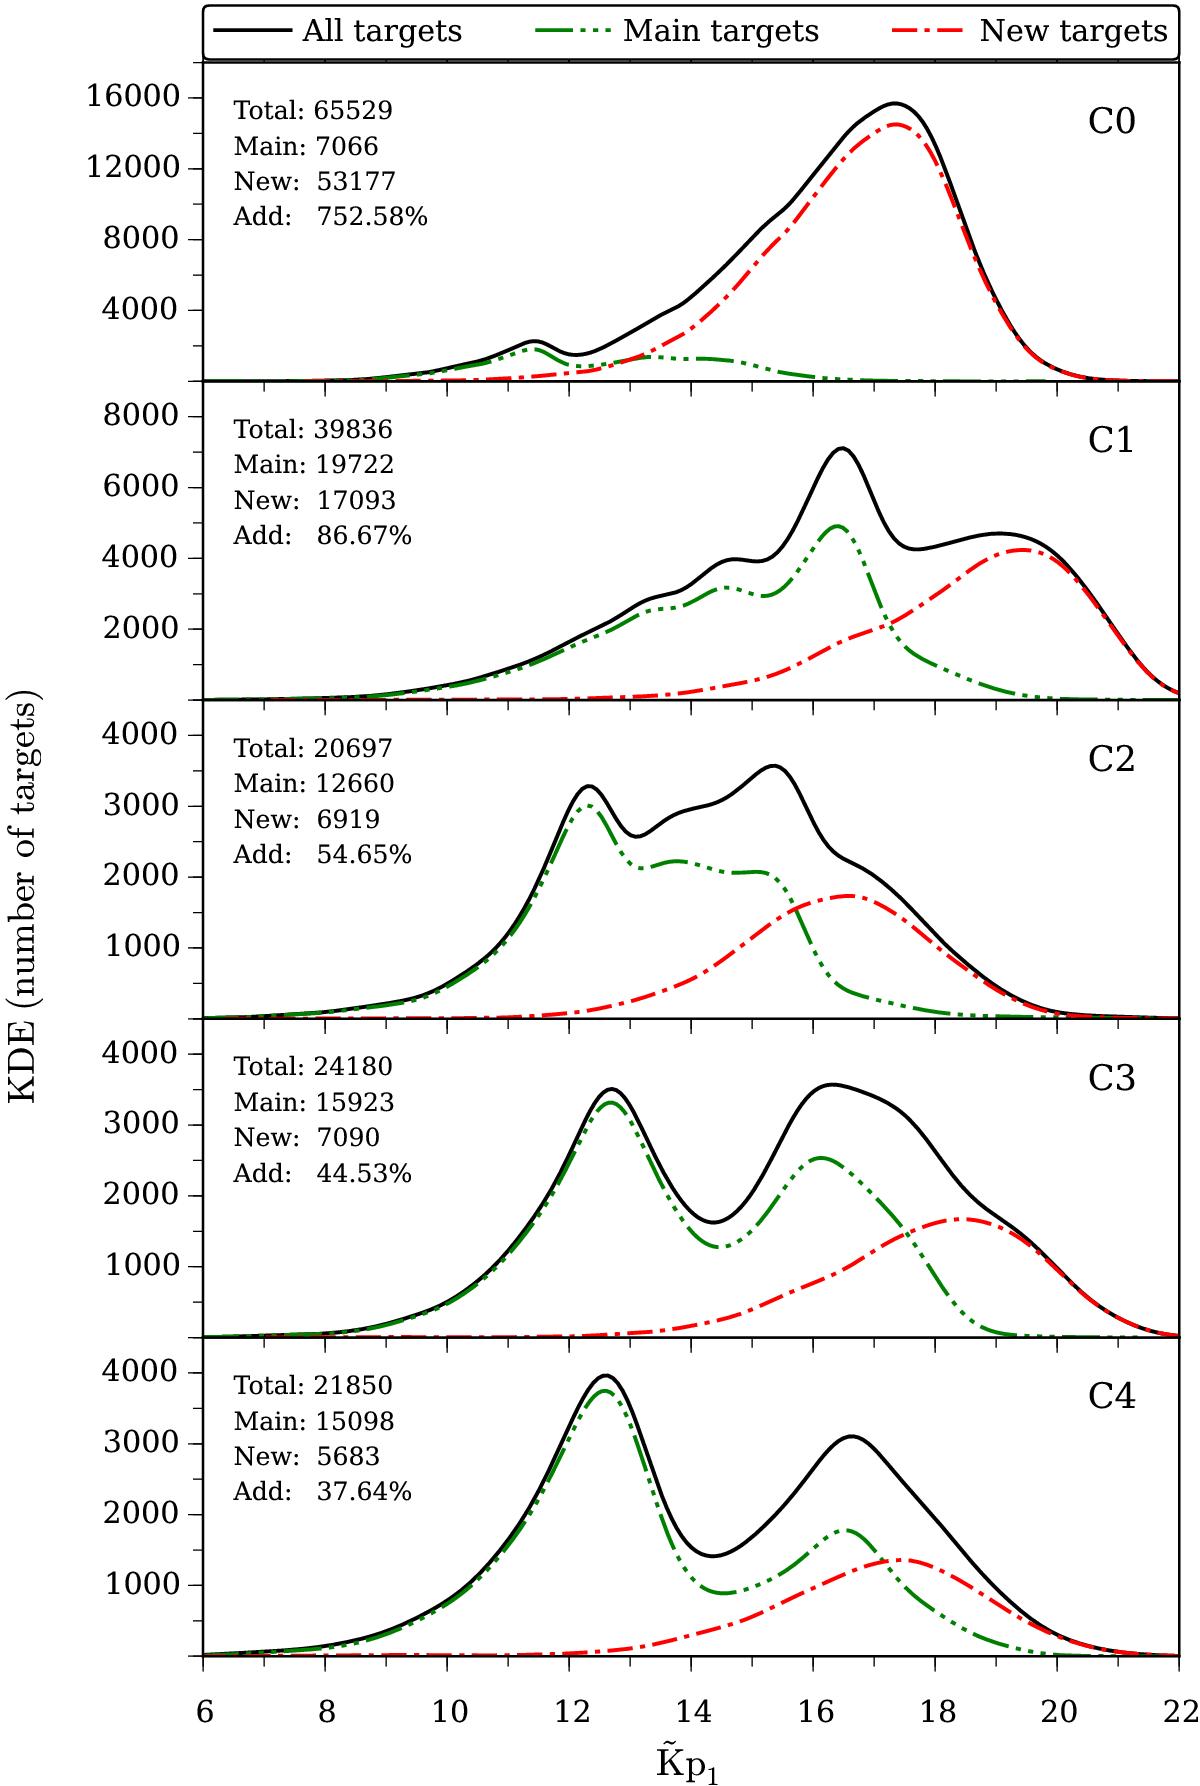
Kernel density estimates (KDE) for the number of targets (with ![]() ) extracted for each campaign, going from C0 in the top panel to C4 in the bottom panel. The KDEs for each panel denote the total number of targets extracted (full black), the main proposed targets (green dash-dot-dot-dot), and the new targets picked up by K2P2 (red dash-dot). The integrals of the KDEs are listed in each panel together with the percentage addition of targets by K2P2. Note the change in units on the ordinate for the top panels (C0 and C1).
) extracted for each campaign, going from C0 in the top panel to C4 in the bottom panel. The KDEs for each panel denote the total number of targets extracted (full black), the main proposed targets (green dash-dot-dot-dot), and the new targets picked up by K2P2 (red dash-dot). The integrals of the KDEs are listed in each panel together with the percentage addition of targets by K2P2. Note the change in units on the ordinate for the top panels (C0 and C1).
Current usage metrics show cumulative count of Article Views (full-text article views including HTML views, PDF and ePub downloads, according to the available data) and Abstracts Views on Vision4Press platform.
Data correspond to usage on the plateform after 2015. The current usage metrics is available 48-96 hours after online publication and is updated daily on week days.
Initial download of the metrics may take a while.