Free Access
Fig. 5
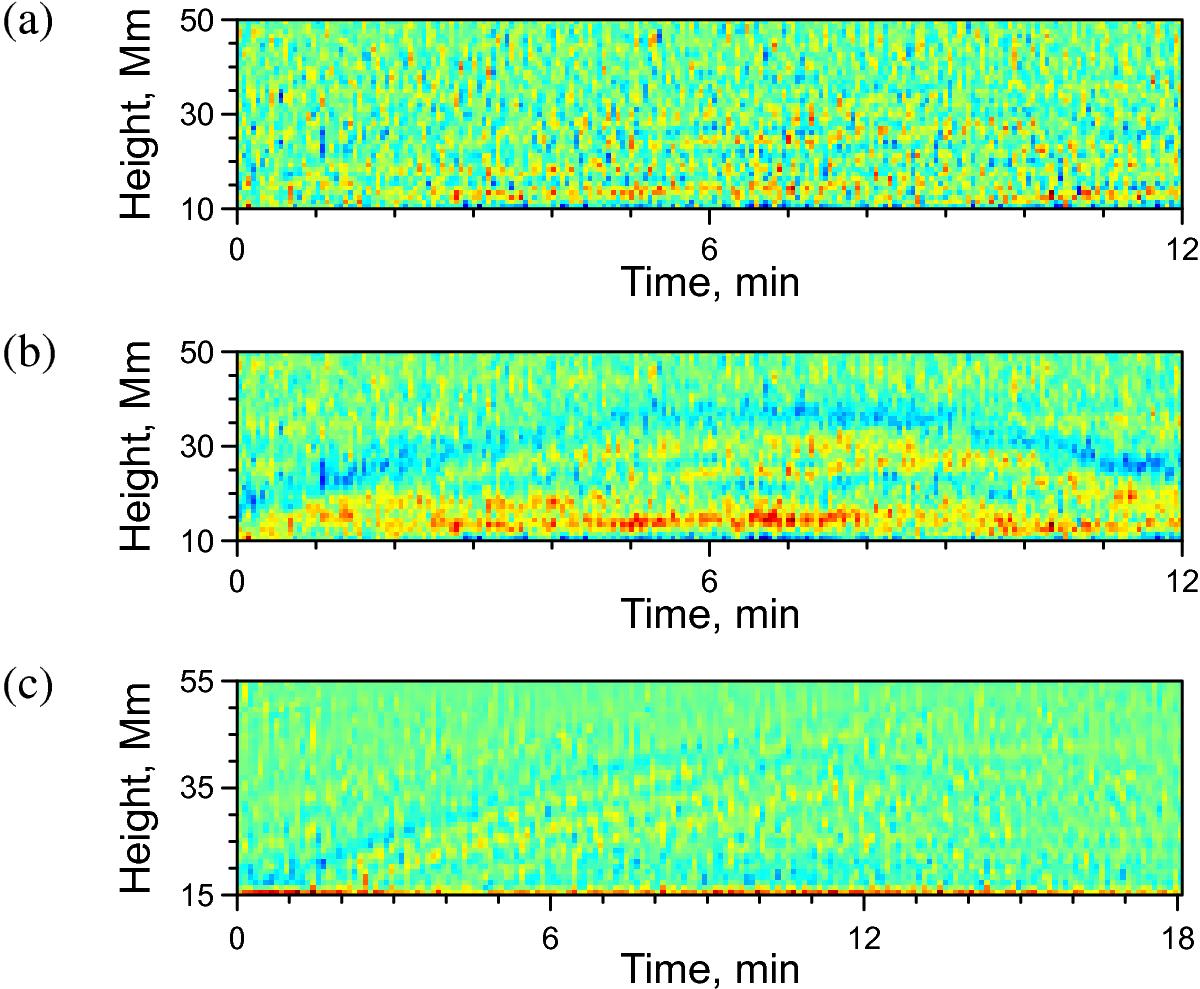
High-frequency component of the density maps removed by the low-pass filter using the optimal (a) and excessively low cut-off frequency (b), and the train of acoustic waves revealed by this procedure in macrospicule No. 10 (c). Blue is negative and red is positive.
Current usage metrics show cumulative count of Article Views (full-text article views including HTML views, PDF and ePub downloads, according to the available data) and Abstracts Views on Vision4Press platform.
Data correspond to usage on the plateform after 2015. The current usage metrics is available 48-96 hours after online publication and is updated daily on week days.
Initial download of the metrics may take a while.