Fig. 4
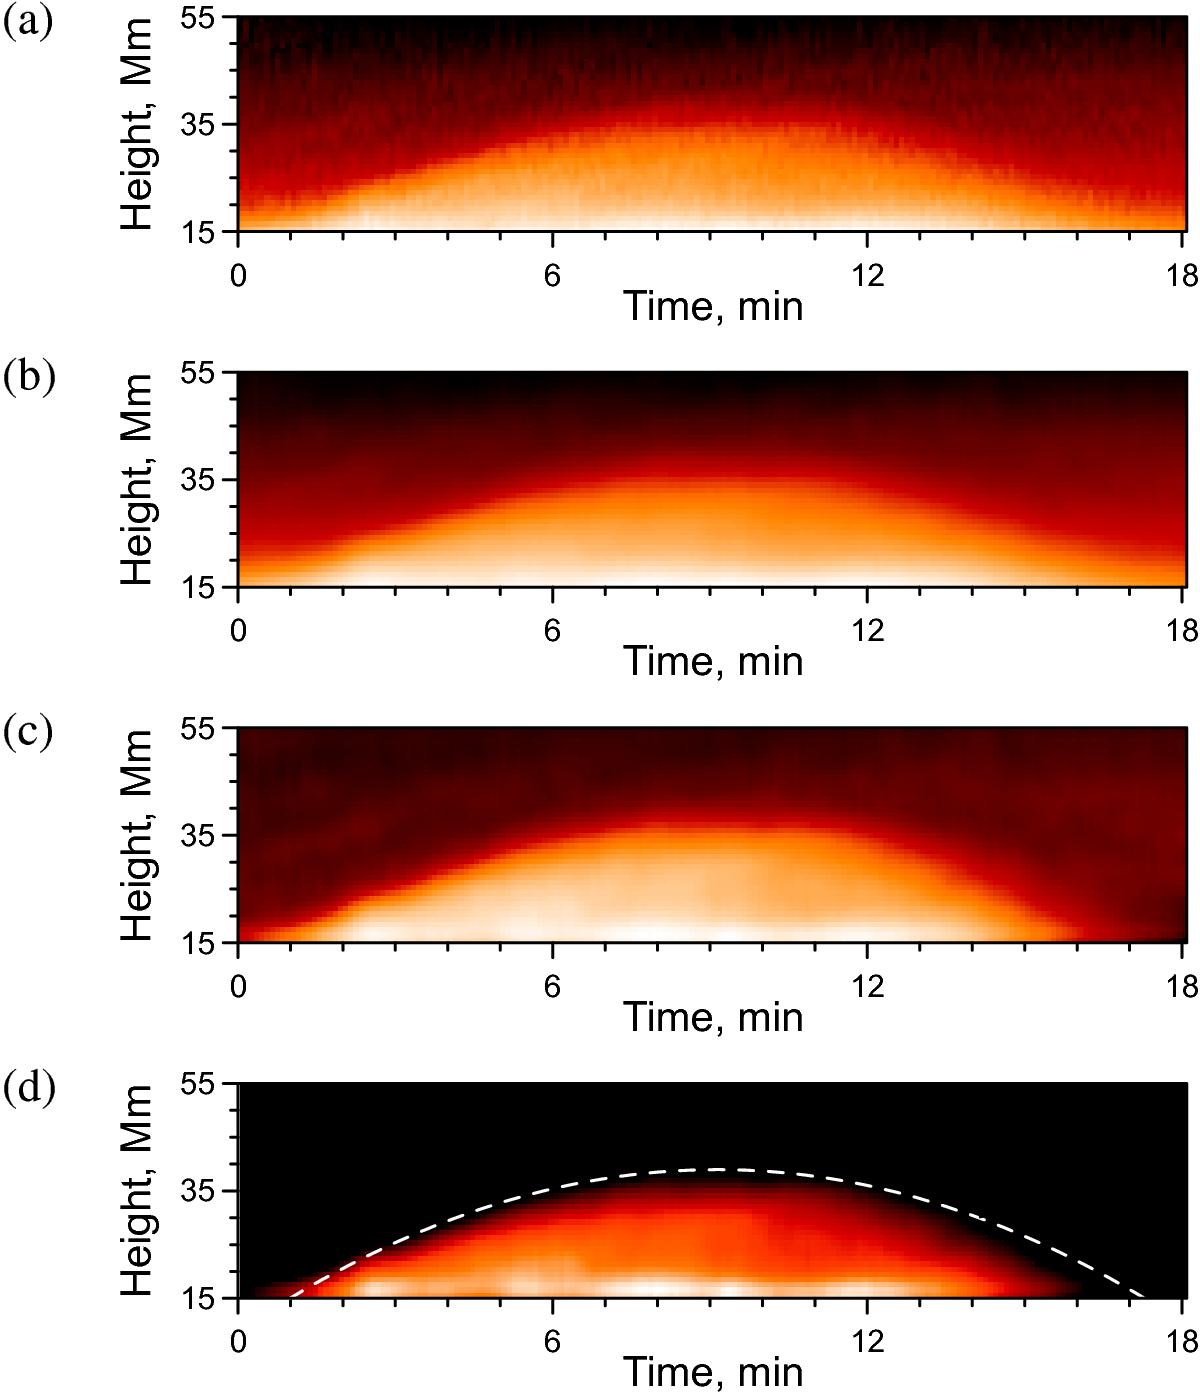
Space-time plots illustrating the sequential steps of the data processing pipeline: the raw density map (a), the output of the low-pass filter (b), the result of background subtraction (c), and the fully pre-processed data array (d). The parabolic fit to the macrospicule’s leading edge trajectory is indicated with the white dashed line in panel (d).
Current usage metrics show cumulative count of Article Views (full-text article views including HTML views, PDF and ePub downloads, according to the available data) and Abstracts Views on Vision4Press platform.
Data correspond to usage on the plateform after 2015. The current usage metrics is available 48-96 hours after online publication and is updated daily on week days.
Initial download of the metrics may take a while.