Fig. 7
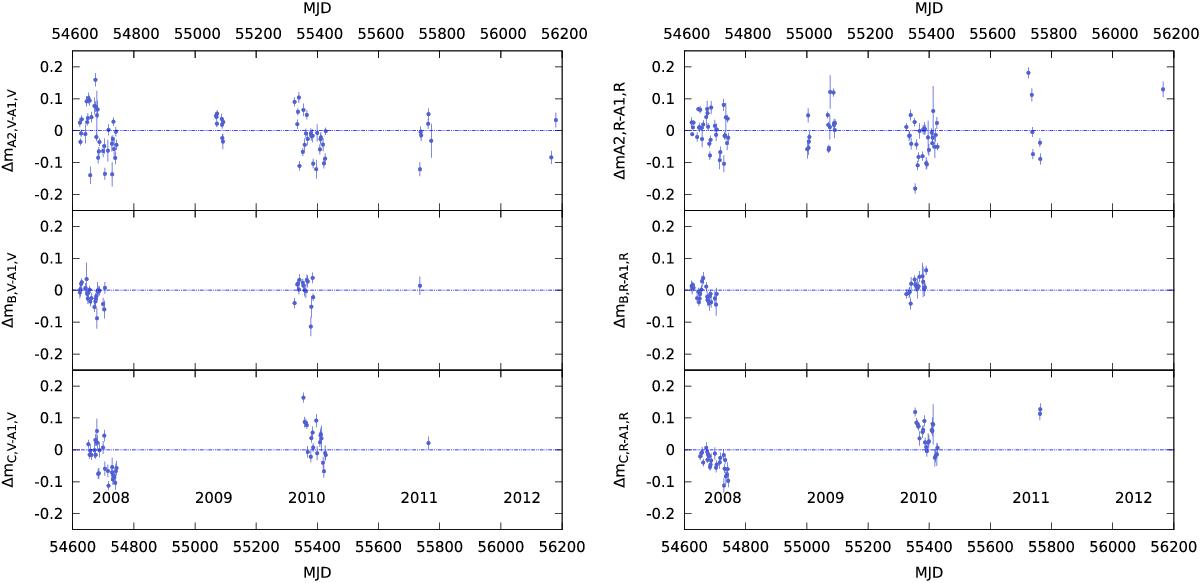
Light curves A2-A1, B-A1, and C-A1 are shown in the V (left) and R band (right) in the upper, middle, and bottom panels, respectively. The differences are computed, after correcting for the known time delays, by interpolating in between the data points of the brightest component of each pair. The difference between C and A1 in the R band shows a significant magnitude variation of 0.16 mag between 2008 and 2011.
Current usage metrics show cumulative count of Article Views (full-text article views including HTML views, PDF and ePub downloads, according to the available data) and Abstracts Views on Vision4Press platform.
Data correspond to usage on the plateform after 2015. The current usage metrics is available 48-96 hours after online publication and is updated daily on week days.
Initial download of the metrics may take a while.