Fig. 15
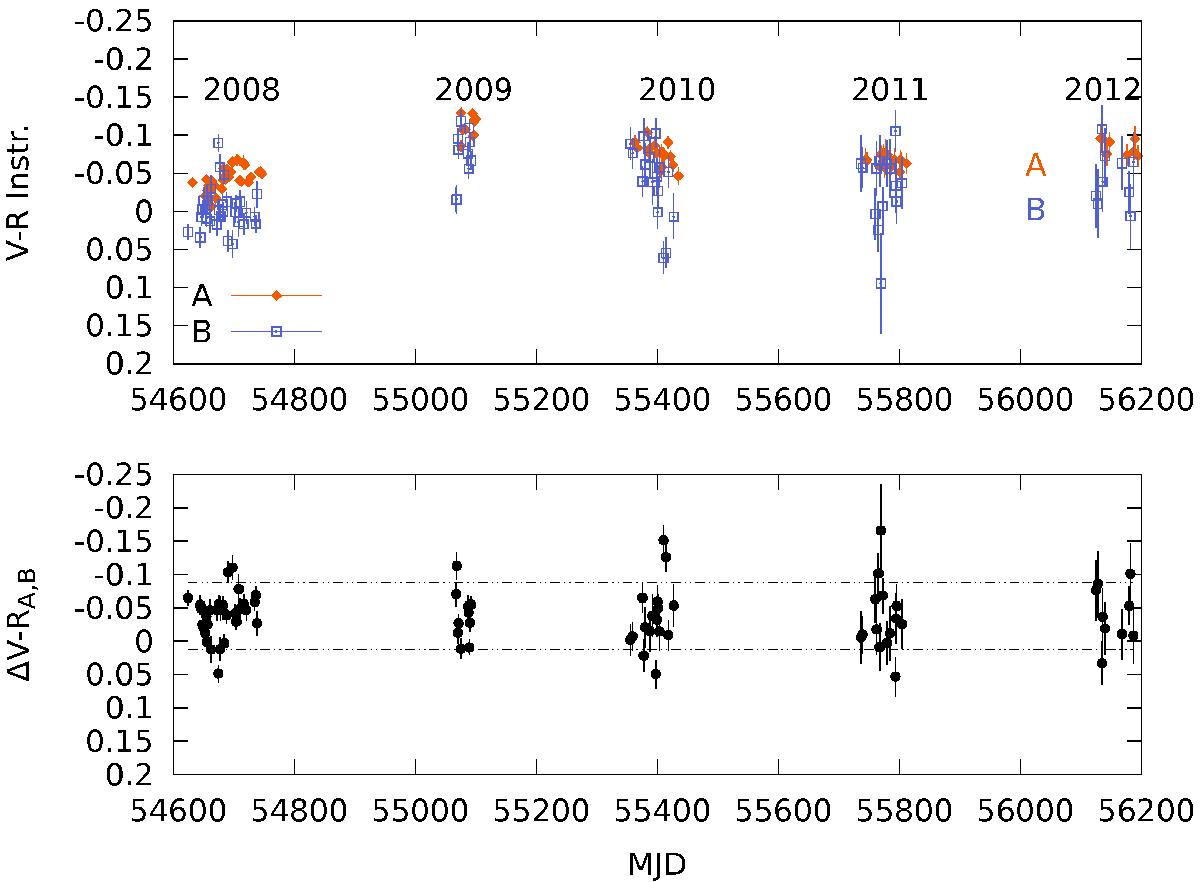
(V−R)Instr. light curves of HE 0047-1756 from 2008 to 2012. Components A (diamonds) and B (squares) are depicted in orange and blue, respectively, in the first upper panel. In the bottom panel we show how the colour difference between the two components evolves. The difference is computed by interpolating the magnitude of the brightest component in the pair in correspondence to the dates at which the weakest one has been observed. The horizontal dashed lines define ±0.05 intervals around the average colour difference.
Current usage metrics show cumulative count of Article Views (full-text article views including HTML views, PDF and ePub downloads, according to the available data) and Abstracts Views on Vision4Press platform.
Data correspond to usage on the plateform after 2015. The current usage metrics is available 48-96 hours after online publication and is updated daily on week days.
Initial download of the metrics may take a while.