Fig. 13
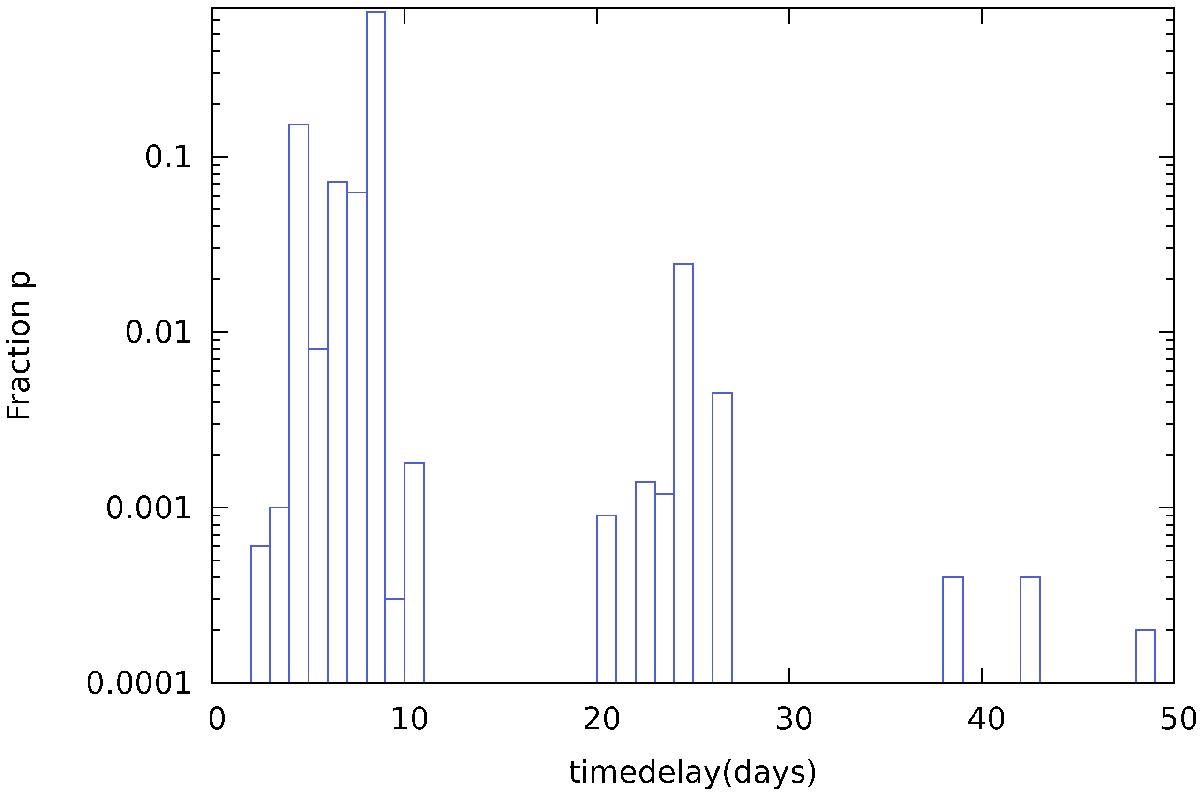
Distribution p for time delays between 0−50 days based on our light curves of components AV, BV, and BR. The probability was computed from 10 000 bootstrap resamplings of the observed light curves. For each resampling the brightest component A was interpolated in correspondence to the dates at which B was observed. The region above the dashed line contains 95% of the statistical weight. Mean value and standard deviation of this region are Δt = 7.6 ± 2.9 days.
Current usage metrics show cumulative count of Article Views (full-text article views including HTML views, PDF and ePub downloads, according to the available data) and Abstracts Views on Vision4Press platform.
Data correspond to usage on the plateform after 2015. The current usage metrics is available 48-96 hours after online publication and is updated daily on week days.
Initial download of the metrics may take a while.