Free Access
Fig. 10
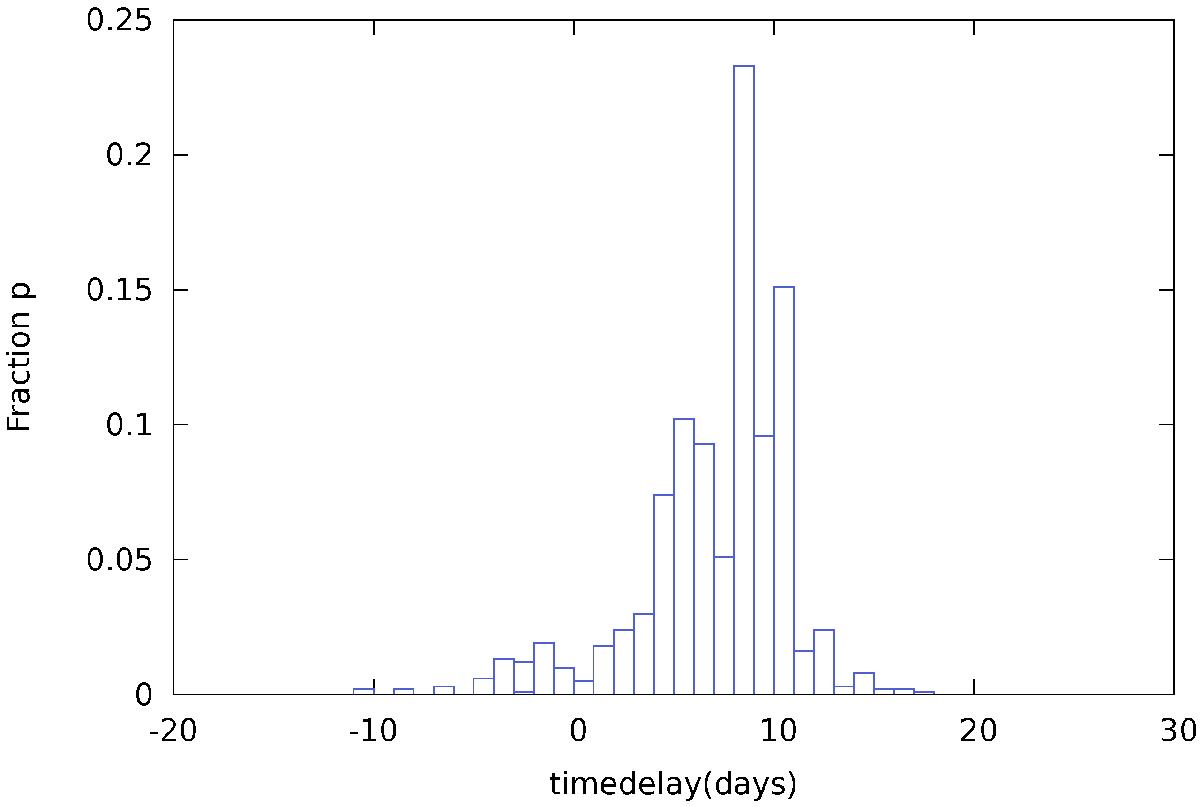
Distribution p for time delays days based on our light curves of components AV and BV obtained by applying the PyCS dispersion method. The probability was computed from 1000 resamplings of the inferred intrinsic, extrinsic, and noise model. Mean value and standard deviation of this distribution are Δt = 8.0 ± 4.2 days.
Current usage metrics show cumulative count of Article Views (full-text article views including HTML views, PDF and ePub downloads, according to the available data) and Abstracts Views on Vision4Press platform.
Data correspond to usage on the plateform after 2015. The current usage metrics is available 48-96 hours after online publication and is updated daily on week days.
Initial download of the metrics may take a while.