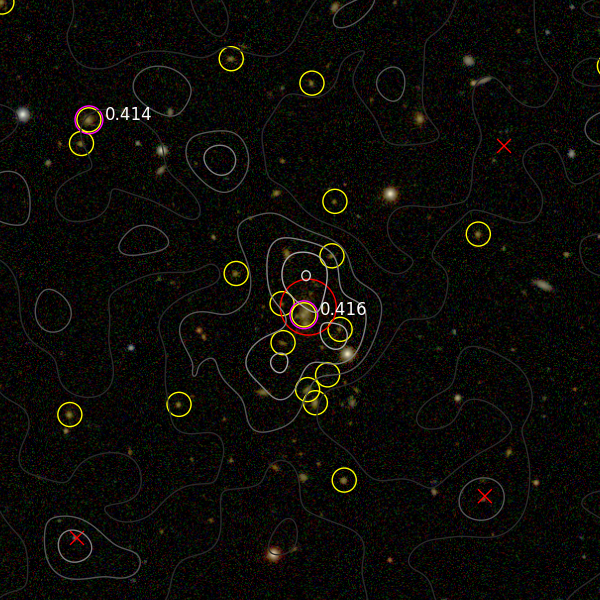
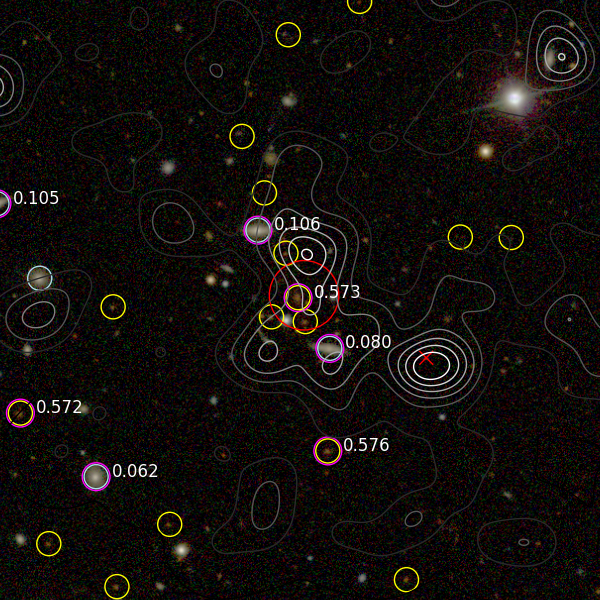
Fig. 3
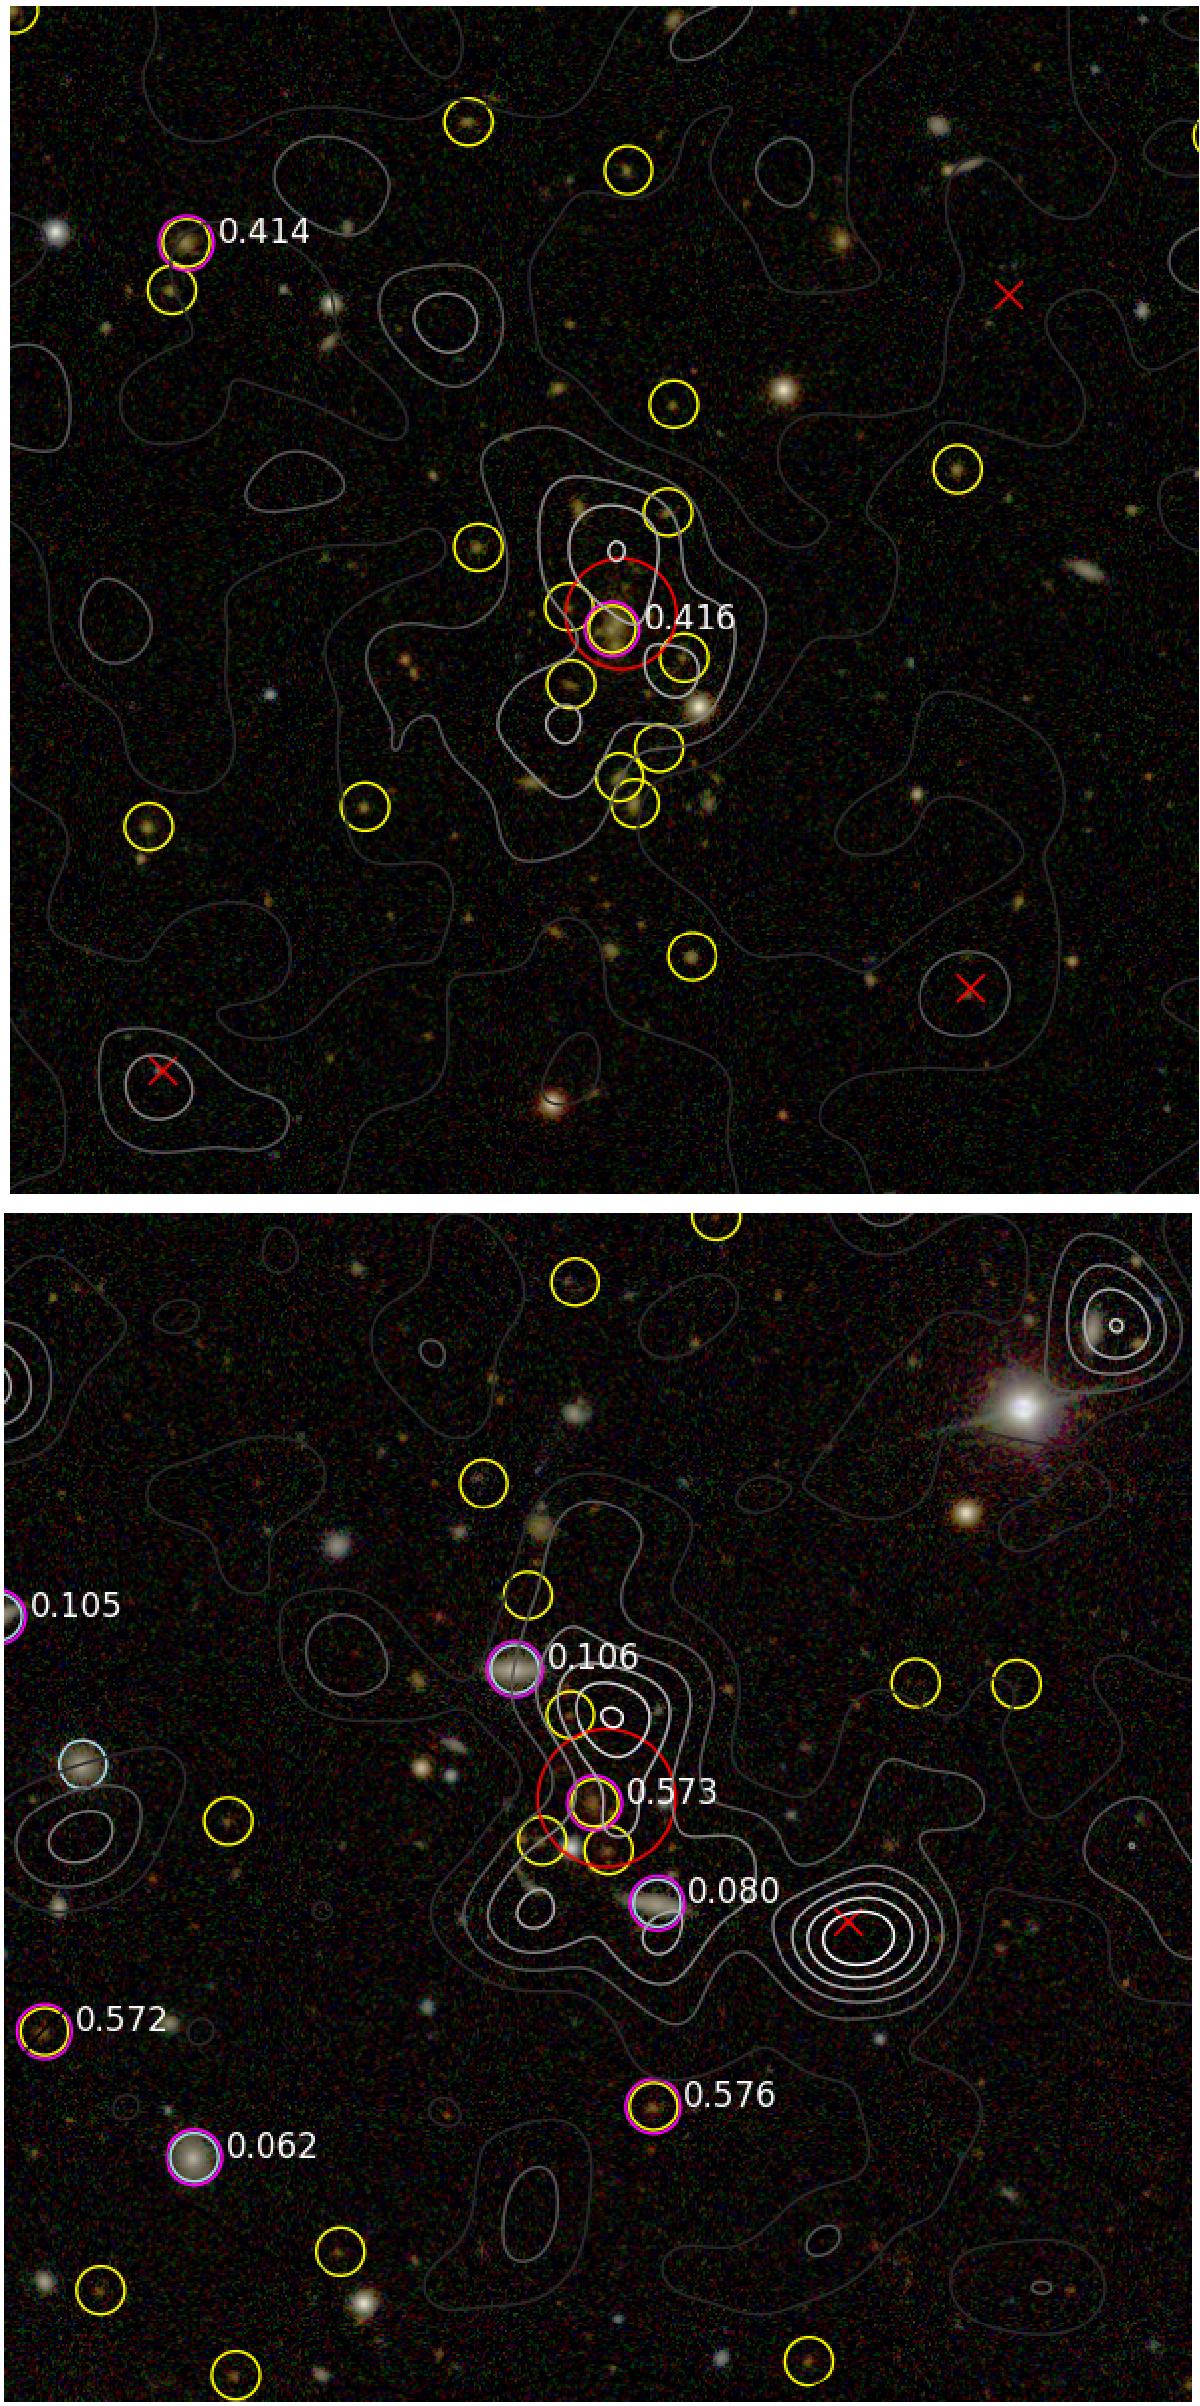
Finding charts for two cluster candidates from Fig. 2. Coloured 2′ by 2′ SDSS images are overlaid with XMM X-ray contours, produced from co-added MOS and PN images in XMM bands 2 and 3. The red circle indicates the extended X-ray source position and extent as provided by 3XMM. The red crosses indicate the positions of point-like X-ray sources. The yellow and light blue circles denote likely cluster members with spectroscopic redshift indicated by purple circle and label where possible. See text for details.
Current usage metrics show cumulative count of Article Views (full-text article views including HTML views, PDF and ePub downloads, according to the available data) and Abstracts Views on Vision4Press platform.
Data correspond to usage on the plateform after 2015. The current usage metrics is available 48-96 hours after online publication and is updated daily on week days.
Initial download of the metrics may take a while.