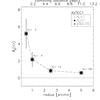
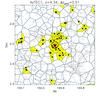
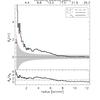
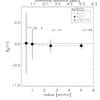
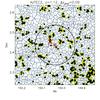
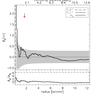
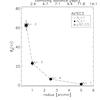
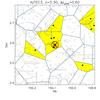
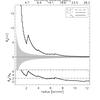
Fig. C.1

Each row corresponds to one SMG. Left panel: δg versus radius, centred at the target SMG (see Sect. 3.1.1). The errors shown are Poisson errors. The number of sources found in a circular area (Nr), and the δg = 0 line are indicated. Also indicated are the points with Poisson probability p ≤ 0.05, as listed in the legend (see Sect. 3.1.1 for details). Middle panel: Voronoi tessellation analysis (VTA; blue lines) shown around each target SMG indicated by the thick red circle. Overdense VTA cells are coloured yellow. The area and density of the cells depend on the number of galaxies in the given redshift range (Δzphot), indicated above the panel. The overdensity centre is shown by the red cross, and the radius within which it was computed is indicated by the black circle (see Sect. 3.1.2 for details). Regions outlined by grey lines and curves indicate the masked areas in the COSMOS photometric catalogue. Right panel: the top panel shows δg versus radius, centred at the overdensity (indicated by the red cross in the middle panel). The SMG’s projected distance from the centre is indicated by the red downwards pointing arrow. The horizontal line indicates the value δg = 0. The meaning of various symbols and linestyles is listed in the legend. The bottom panel shows the significance of the overdensity (δg/σδg = 0) as a function of radius. The dashed horizontal line designates the threshold beyond which the false detection probability is ≤20% (see Sect. 3.1.3 for details).
Current usage metrics show cumulative count of Article Views (full-text article views including HTML views, PDF and ePub downloads, according to the available data) and Abstracts Views on Vision4Press platform.
Data correspond to usage on the plateform after 2015. The current usage metrics is available 48-96 hours after online publication and is updated daily on week days.
Initial download of the metrics may take a while.