Fig. 7
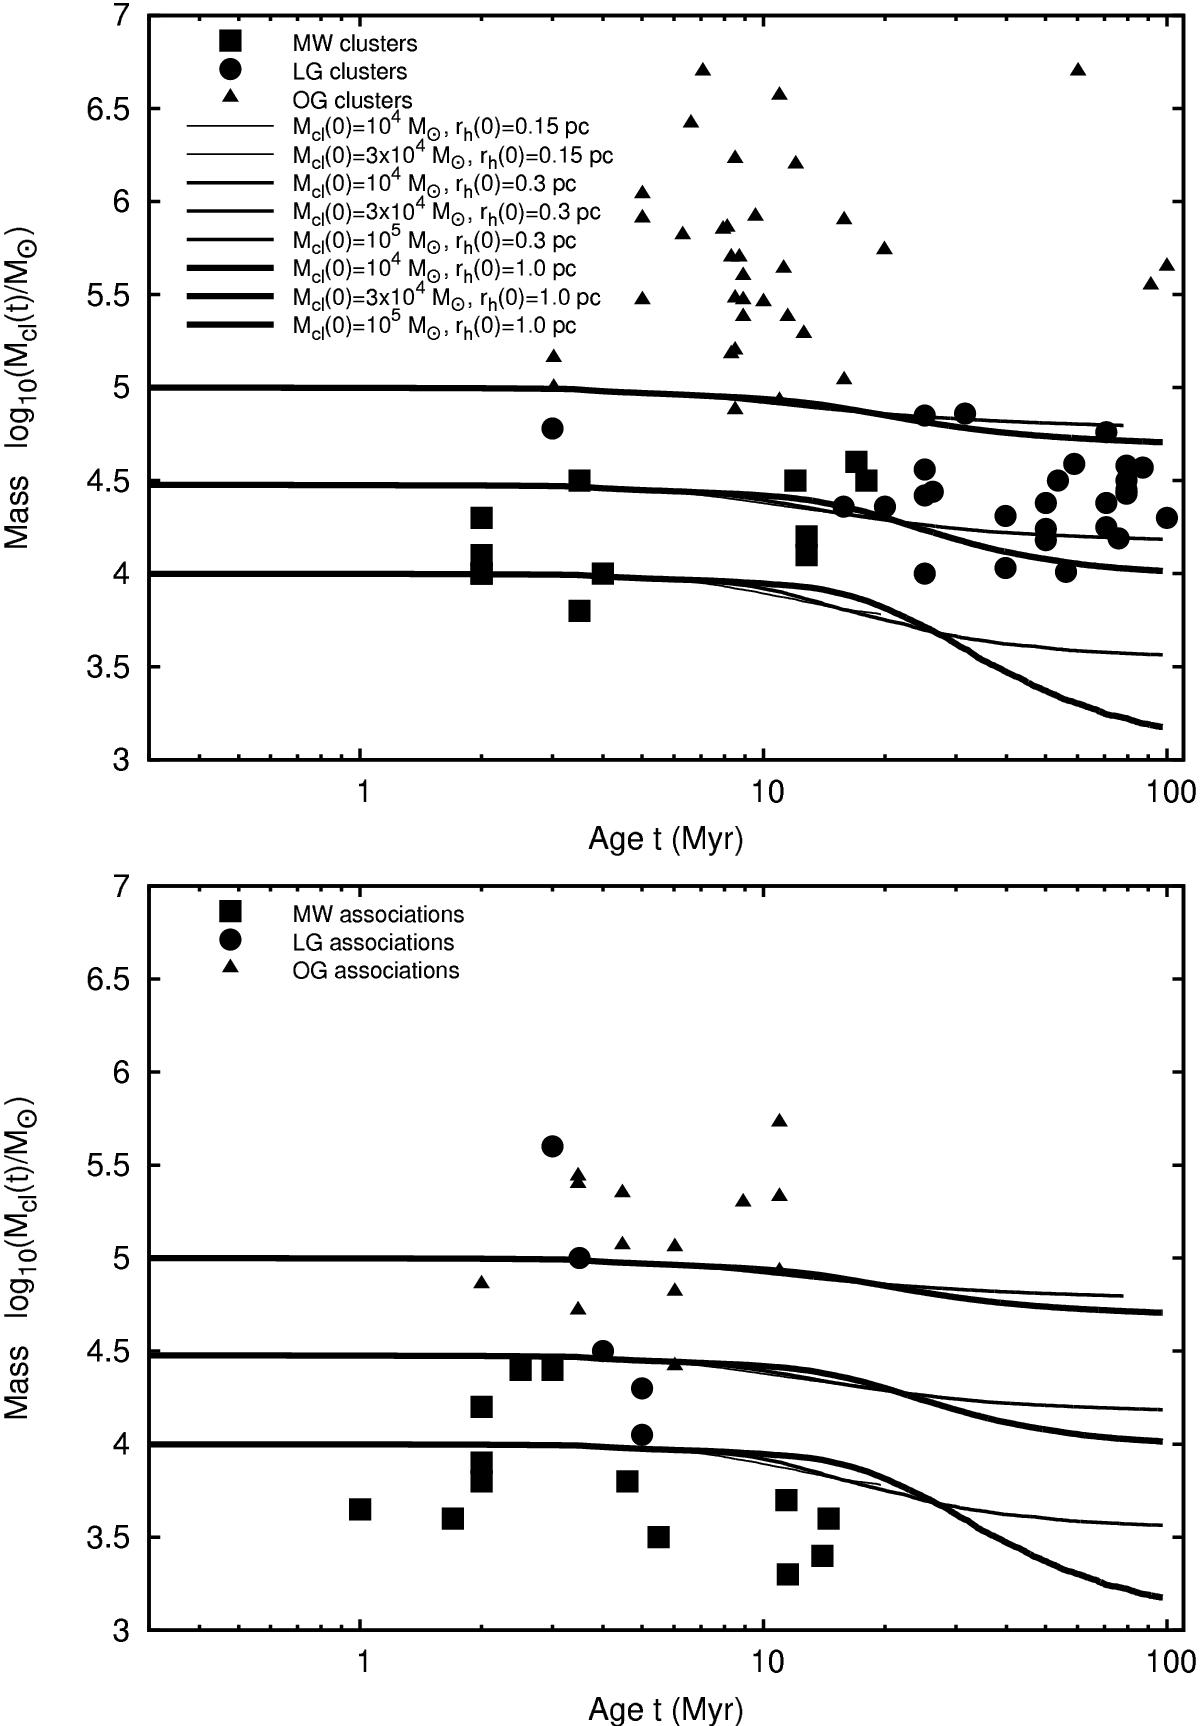
Curves give the evolution of the instantaneous total bound stellar mass log 10(Mcl(t)) for the calculations in Fig. 6 that include an initial gas dispersal phase (see Table 4, top part and text). In both panels, data points corresponding to the same young massive clusters and associations (in the top and bottom panels, respectively) as in Figs. 3 and 6 are used, but without colour-coding. The same set of curves are overlaid on both panels and the legends are given in the top panel.
Current usage metrics show cumulative count of Article Views (full-text article views including HTML views, PDF and ePub downloads, according to the available data) and Abstracts Views on Vision4Press platform.
Data correspond to usage on the plateform after 2015. The current usage metrics is available 48-96 hours after online publication and is updated daily on week days.
Initial download of the metrics may take a while.